Monitoring NVIDIA GPU Usage in Kubernetes with Prometheus
If you’re familiar with the growth of ML/AI development in recent years, you’re likely aware of leveraging GPUs to speed up the intensive calculations required for tasks like Deep Learning. Using GPUs with Kubernetes allows you to extend the scalability of K8s to ML applications.
However, Kubernetes does not inherently have the ability to schedule GPU resources, so this approach requires the use of third-party device plugins. Additionally, there is no native way to determine utilization, per-device request statistics, or other metrics—this information is an important input to analyzing GPU efficiency and cost, which can be a significant expenditure.
This article will explore the use of GPUs in Kubernetes, outline the key metrics you should be tracking, and detail the process of setting up the tools required to schedule and monitor your GPU resources.
Requesting GPUs
Although the syntax for requests and limits is similar to that of CPUs, Kubernetes does not inherently have the ability to schedule GPU resources. To handle the nvidia.com/gpuresource, the nvidia-device-plugin DaemonSet must be running. It is possible this DaemonSet is installed by default—you can check by running kubectl get ds -A. On a node with a GPU, run kubectl describe node <gpu-node-name>and check if the nvidia.com/gpu resource is allocable:
Capacity:
  attachable-volumes-aws-ebs:  39
  cpu:                         8
  ephemeral-storage:           83873772Ki
  hugepages-1Gi:               0
  hugepages-2Mi:               0
  memory:                      62769452Ki
  nvidia.com/gpu:              1
  pods:                        58
Scheduling a pod to utilize this resource (once it is available) is similar to creating CPU or memory limits and requests. Let’s look at an example from the official K8s documentation for a pod using CUDA vectoradd:
apiVersion: v1
kind: Pod
metadata:
  name: cuda-vector-add
spec:
  containers:
    - name: cuda-vector-add
      # https://github.com/kubernetes/kubernetes/blob/v1.7.11/test/images/nvidia-cuda/Dockerfile
      image: "k8s.gcr.io/cuda-vector-add:v0.1"
      resources:
        limits:
          nvidia.com/gpu: 1 # requesting 1 GPU
Examining the pod logs, we get:
[Vector addition of 50000 elements]
Copy input data from the host memory to the CUDA device
CUDA kernel launch with 196 blocks of 256 threads
Copy output data from the CUDA device to the host memory
Test PASSED
Done
If you already have a Docker image with the NVIDIA runtime configured, you can have it deployed on a cluster in minutes. But running even a single node with a requestable GPU can cost upwards of several hundred or even several thousand USD monthly. To keep track of GPU utilization and ensure GPU resources are not overprovisioned, we can leverage another piece of Nvidia software to provide usage metrics.
GPU usage metrics
Theoretically, seeing GPU utilization is as simple as using the nvidia-smi (System Management Interface) in any container with the proper runtime. To see this in action, first create a pod using the NVIDIA dcgmproftester to generate a test GPU load:
apiVersion: v1
kind: Pod
metadata:
  name: dcgmproftester
spec:
  restartPolicy: OnFailure
  containers:
  - name: dcgmproftester
    image: nvidia/samples:dcgmproftester-2.0.10-cuda11.0-ubuntu18.04
    args: ["--no-dcgm-validation", "-t 1004", "-d 240"]
    resources:
      limits:
        nvidia.com/gpu: 1
    securityContext:
      capabilities:
        add: ["SYS_ADMIN"]
Then, exec into the pod:
kubectl exec -it dcgmproftester -- nvidia-smi
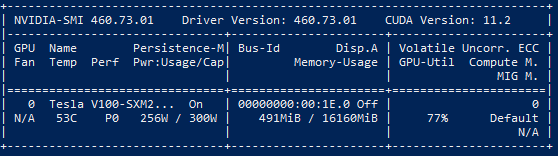
This can be done with any pod capable of utilizing a GPU. We can see our test load under GPU-Util, along with other information such as Memory-Usage. However, the SMI is a command line utility—it does not export data. For scrapable metrics, we can deploy the NVIDIA GPU operator alongside Prometheus.
To install the GPU operator using Helm, first install the kube-prometheus-stack using:
helm install prometheus-community/kube-prometheus-stack --generate-name
Note: If you already have Prometheus deployed in your cluster, you should be able to skip this first step.
Then, install the GPU operator using:
helm install --wait --generate-name nvidia/gpu-operator -n kube-system --set driver.enabled=false --set toolkit.enabled=false --debug
The GPU operator and dependent pods in the gpu-operator-resources namespace should all initialize. Once this is done, check if metrics are being emitted by port forwarding into the metrics exporter by getting the pod name and port forwarding to it:
kubectl get pods -n gpu-operator-resources -l app=nvidia-dcgm-exporter

kubectl -n gpu-operator-resources port-forward <dcgm exporter pod name> 8080:9400
Or, instead of port forwarding to the pod, you can port forward to the service by running:
kubectl -n gpu-operator-resources port-forward service/nvidia-dcgm-exporter 8080:9400
There are a few metrics which are relevant to usage.
-
DCGM_FI_DEV_GPU_UTILis what we will be focusing on. It represents a simple GPU utilization percentile consistent with the above GPU-Util field in the SMI. However, there are more specific metrics available. -
DCGM_FI_PROF_GR_ENGINE_ACTIVErepresents the average portion of time any graphics/compute engine was active. -
DCGM_FI_PROF_SM_OCCUPANCYis the fraction of warps on a multiprocessor relative to the total concurrent warps supported.
To learn more about these metrics, see the DCGM documentation.
Note that many of the available metrics are not enabled by default. To change the enabled metrics from the defaults, edit the config csv (uncommenting the metrics that you wish to enable) and create a ConfigMap with:
kubectl create configmap dcp-metrics-included --from-file dcp-metrics-included.csv -n kube-system
Edit the dcgm-exporter DaemonSet to include:
In the DCGM template container:
        - mountPath: /etc/dcgm-exporter/dcp-metrics-included.csv
          name: config
          subPath: dcp-metrics-included.csv
Under template spec volumes:
      - configMap:
          items:
          - key: dcp-metrics-included.csv
            path: dcp-metrics-included.csv
          name: dcp-metrics-included
        name: config
Finally, change the update strategy to OnDelete to prevent overwriting:
  updateStrategy:
    type: OnDelete
As an alternative to editing the DaemonSet, on install, the flag --set dcgmExporter.config.name=<config-map-name> can be used.
After the pod restarts with this new configuration, you should be able to query the new metric in your Prometheus database—or view the metrics directly from the pod by port forwarding again:
kubectl -n gpu-operator-resources port-forward service/nvidia-dcgm-exporter 8080:9400
And navigating to localhost:8080/metrics
Conclusion
GPU acceleration is a rapidly evolving field within Kubernetes. With the GPU Operator emitting utilization metrics, you can leverage this data to perform more robust operations like cost analysis using Kubecost.
Kubecost integrates with NVIDIA DCGM metrics to offer further insight into GPU-accelerated workloads, including cost visibility and identification of overprovisioned GPU resources. To get started, refer to https://www.kubecost.com/install.html.
Notes
The state of NVIDIA GPU metrics and monitoring in Kubernetes is rapidly changing and often not well documented, both in an official capacity as well as on other common troubleshooting channels (GitHub, StackOverflow). This post is written to help users set up the software needed to use these metrics. To that end, I have included a list of some of the issues I faced.
-
Tutorials online often feature outdated information. With how quickly these tools are changed, this can mean problems arising out of otherwise very clear install processes.
-
Make sure the software used is up to date; in particular, note the difference between the deprecated gpu-monitoring-tools, the standalone dcgm, and the GPU operator.
-
DCGM on GKE cluster does not feature pod or container information in metrics. As of time of writing, the only reference I could find was an issue on the gpu-monitoring-tools repo.
-
GPU operator pods cannot spin up on GKE cluster in namespace
gpu-operator-resourcesdue to pod priority issue, with messageError creating: insufficient quota to match these scopes: [{PriorityClass In [system-node-critical system-cluster-critical]}]. This is because GKE limits consumption of this priority class by default. -
GPU operator CUDA validator init containers cannot start on AWS g4dn.xlarge node, with error all CUDA-capable devices are busy or unavailable. AWS p3/p2 instances seem to work fine.