On-Premises Kubernetes Cost Monitoring
With the power of automated orchestration, Kubernetes has solved many of the complex container management problems administrators faced and unleashed a global adoption of containerized workloads. The next frontier in container management has shifted to monitoring the ever-expanding costs of Kubernetes clusters.
In this article, we explain how to track the costs of an on-premises Kubernetes cluster, and use Kubecost to automate much of this process. One of the advantages of using Kubecost is that it’s available in multiple forms: a free download for unlimited individual clusters, an enterprise version, and a hosted version.
Monitoring the cost of a Kubernetes workload requires a process involving multiple steps:
- Assign an hourly operating cost to the K8s cluster and its supporting assets
- Track usage by cluster tenant by using features such as labels or namespaces
- Allocate resource usage and associated costs to each cluster tenant
- Detect spending overages relative to a specified per-tenant daily budget
- Monitor health to avoid performance bottlenecks while reducing costs
However, monitoring the cost of a cluster residing in a data center is more challenging than a cluster hosted in a public cloud simply metered based on an hourly price. The total cost of ownership of an on-premises cluster is more difficult to assess due to a mix of capital expenditure, operating expense, and labor cost. It’s also the starting point for monitoring the cost of a Kubernetes cluster, as shown below.

This article will explain the five stages in the diagram above and introduce Kubecost.
1. Assign Value
The first step in monitoring the cost of a Kubernetes cluster is by assigning value to the total cost of owning the underlying cluster nodes including the attached storage and the underlying network. But, let’s first gain context by reviewing the price of a Kubernetes cluster hosted in a public cloud using AWS pricing as an example.
Hosted Kubernetes Pricing
Customers pay $0.10 per hour to use an AWS EKS cluster and pay for the provisioned EC2 instance and EBS storage nodes. The minute you terminate the cluster and the underlying nodes, the AWS charges stop for that cluster. Tools such as the AWS Cost Explorer and the Cost and Usage Report(CUR) record and display the costs. So it’s easy to know how much you have spent each hour of each day.
On-Premises Kubernetes Cluster Costs
The cost of a node of an on-premises Kubernetes cluster is more complicated to calculate since you pay for the hardware upfront as a capital expenditure and use the servers (that make up the cluster) for a predetermined time period, usually 3 - 5 years, before disposing of them. You may also have licensed software installed, such as OSes, security, storage, and network solutions. Installing the servers in a data center also requires space, power, and cooling. In addition, you must account for the labor costs to install and maintain the server over time.
As you can see, various line items must be accounted for and added together to derive the final daily cost of using an on-premises Kubernetes cluster. The table below summarizes these costs over five years and amortizes (or spreads) those costs over months, days, and hours by simply dividing them. For example, the upfront server cost is first divided by 5 to reflect an annual cost, and then it’s divided by 12 to show its amortized monthly cost. We have chosen five years because it is a common hardware refresh timeline.
| Cost Item | Over 5 years | Per month | Per day | Per Hour | Note |
|---|---|---|---|---|---|
| Server | $1,500 |
$25 |
$0.83 |
$0.03 |
Upfront purchase |
| OS license | $900 |
$15 |
$0.50 |
$0.02 |
Upfront purchase |
| SSD Storage | $750 |
$13 |
$0.42 |
$0.02 |
Upfront purchase |
| Router Port | $250 |
$4 |
$0.14 |
$0.01 |
Upfront purchase |
| Cabling | $150 |
$3 |
$0.08 |
$0.00 |
Upfront purchase |
| Uninterruptible power supply (UPS) | $100 |
$2 |
$0.06 |
$0.00 |
Upfront purchase |
| Installation labor costs | $250 |
$4 |
$0.14 |
$0.01 |
One-time payment |
| Datacenter space, cooling, and power | $3,000 |
$50 |
$1.67 |
$0.07 |
Paid monthly |
| Maintenance labor costs | $600 |
$10 |
$0.33 |
$0.01 |
Paid monthly |
| Total | $7,500 |
$125 |
$4.17 |
$0.17 |
The resulting hourly rate of a server installed in a data center should work out to be generally in line with the cost of an EC2 with a similar configuration. The main difference is that you can stop using the EC2 whenever you choose, but you purchase the hardware for a data center and commit to using it over its lifespan. If you virtualize your hardware using a VMware or KVM hypervisor, then you would divide the node cost into the number of virtual machines (VM) provisioned on the physical node, assuming the VMs have an identical configuration.
You may take one additional step to decompose a node’s monthly cost ($125) shown in the table above into separate computing resources, namely CPU, RAM, GPU, and Storage. Later in this article, we will discuss allocating costs to various Kubernetes cluster tenants. By decomposing costs into computing resource vectors as presented in the table below, a cost allocation report can assign a more accurate value to a GPU-intensive workload than a storage-intensive workload. The decomposition simply uses a percentage-based estimation in our example. Note that the presented values are for illustrative purposes.
| Computing Resource | Est. % | Per month |
|---|---|---|
| Monthly CPU Cost | 25% |
$31 |
| Monthly RAM Cost | 25% |
$31 |
| Monthly GPU Cost | 40% |
$50 |
| Monthly Storage Cost | 10% |
$13 |
| Total Node Cost | 100% |
$125 |
2. Organize Workloads
Departments, teams, applications, and projects typically share one Kubernetes cluster. A shared tenant model saves on the general costs involved in purchasing, provisioning, and operating a cluster. Sharing has implications in administration, security, performance, and reporting. This level of control requires a logical separation or at least a designation of the Kubernetes components owned by each tenant. The most common designation approach is to “label” (similar to tagging) the dedicated Kubernetes pod (along with its containers) hosting the workload.
In the example below, labels are used to associate a pod with an environment (staging vs. production) and a team (named kube-team).
apiVersion: v1
kind: Pod
metadata:
 name: my-pod
 labels:
   environment: staging
   team: kube-team
spec:
 containers:
   - name: my-container
     image: "k8s.gcr.io/my-app:v0.1"
     resources:
       limits:
        cpu: 1
Another strategy for larger environments is to create a Kubernetes namespace for each team or application to offer more configuration independence. In the next example, a kubectl command lists the namespaces provisioned in a cluster, including the namespaces automatically created by the Kubernetes system, such as “kube-system”.
$ kubectl get namespace
NAME                        STATUS     AGE
default                     Active     1d
kube-node-lease             Active     1d
kube-public                 Active     1d
kube-system                 Active     1d
The use of labels and namespaces is necessary within a Kubernetes cluster to allocate resource usage to individual tenants. This topic is the focus of this article’s next section.

Comprehensive Kubernetes cost monitoring & optimization
3. Allocate Usage and Cost
Once labels identify cluster workloads, the next challenge is to allocate a specific cost to each tenant based on usage. This challenge has many facets since, for each tenant, you must calculate:
- The usage of CPU, GPU, memory, network, and persistent storage.
- The amount of requested but unused resources that causes waste.
- The usage of out-of-cluster resources such as databases or blob storage.
- The proportionate use of cloud instance reservations and support services.
Let’s take network usage as an example. Native Kubernetes tooling doesn’t calculate egress traffic usage by default. Measuring network activity would require installing a script (or lightweight agent) to collect data directly from the Linux kernel’s nf_conntrack module. The IP addresses would then have to be mapped to labels and namespaces and then allocated to an individual cluster tenant. Once each unit of traffic (e.g., kilobyte) has an exact value assigned to it, only then can administrators attribute a dollar value to each tenant’s network use.
This example hints at the magnitude of complexity involved in allocating total costs to each Kubernetes cluster tenant. This challenge led to the founding of Kubecost which provides this exact functionality as a core feature.
4. Detect Spending Overages
Cost monitoring is helpful only if it can lead to adherence to a budget. The only way to stay within budget is to stop overspending before it becomes an end-of-month surprise. Once each Kubernetes tenant knows its own allocated daily spending according to usage, each tenant can set a daily budget based on historical use and forecasted business plans. A cost alert would simply compare each day’s allocated charges to a preset daily budget value and generate a notification to alert the right person who can decide how to reduce usage to stay within the daily budget.
Kubecost offers various types of alerts to help with this process, summarized below into four categories:
- Recurring Update: Schedule reports of per-tenant spending.
- Budget: Detect a budget overrun relative to a defined threshold.
- Spend Change: Detect a jump relative to a historical moving average.
- Efficiency: Detect over and under-used computing resources.
Note that savings insights are also available in Kubecost to identify opportunities for cost reduction based on preset policies.
5. Monitor Health
All of the focus on staying within budget and reducing unnecessary spending can inadvertently create resource bottlenecks during critical peak business hours. The best way to ensure cost management measures aren’t cutting too deep into performance is to monitor your cluster’s health based on best practices and customized policies watching for conditions such as low cluster memory or pods stuck in a restart loop.
For example, comparing CPU and memory usage over the past 24 hours and comparing it to provisioned capacity would indicate if the workloads lack the required headroom to operate safely. Another example is tracking out-of-memory (OOM) events and detecting an increase in their occurrence over ten minutes. One more example is a policy that would follow the total requested memory by all workloads and compare it to the overall available cluster memory. When these two numbers are too close, it would mean that the failure of one node would create havoc in the entire cluster.
Kubecost pre-populates its product with checks to monitor the health of the clusters based on industry best practices to track various performance and security aspects of a Kubernetes cluster so that users can feel safe and be alerted of any violations while reducing unnecessary spending.
K8s clusters handling 10B daily API calls use Kubecost
Learn MoreGetting Started With Kubecost
Installing Kubecost
As referenced earlier in this article, Kubecost is a free tool for individual clusters designed to monitor your on-premises cluster costs. The usage data it collects never leaves your cluster, so there is no need to worry about security and privacy. However, a hosted version is also available for those who wish to defer the infrastructure maintenance and software updates to Kubecost.
To get started:
- Use a Helm chart to install Kubecost (it should take about 5 minutes)
- Enter estimated costs for your cluster’s on-premises infrastructure (see below)
Kubecost is available for download as a Helm chart at this link, which contains further instructions: https://www.kubecost.com/install.html.
Entering Custom Pricing Values
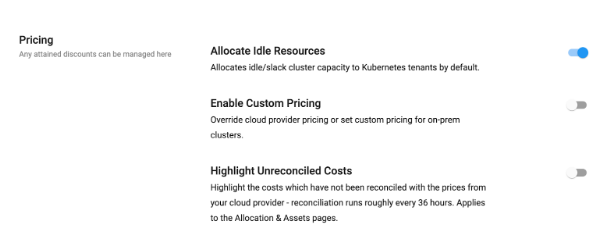
Once Kubecost is installed, you can navigate to the settings page (accessible in the lower left of the user interface) and “enable custom pricing,” as shown below.
Once custom pricing is enabled, you will see the form below to enter your estimated custom pricing for your cluster nodes’ computing resources. The values shown in the screenshot below are meant for illustrative purposes.
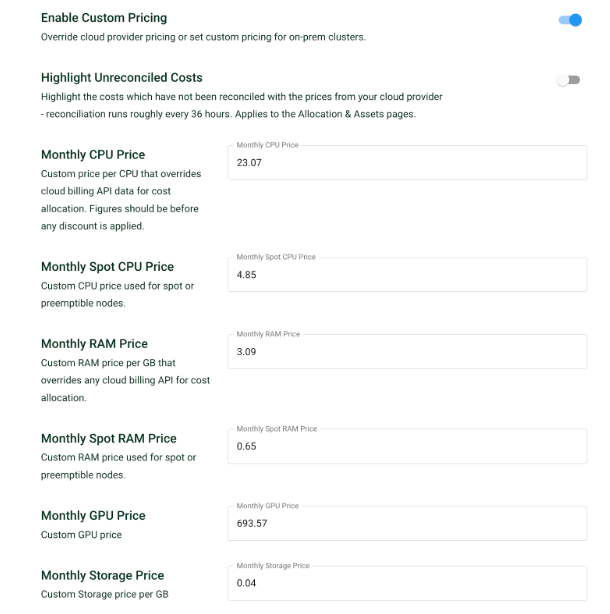
In the first section of this article, we introduced an approach for calculating the costs of a node supporting a Kubernetes cluster and decomposing it into cost values for CPU, RAM, GPU, and Storage. By following the approach that we introduced, you can calculate the cost of a hardware node used in your data center, decompose that cost into computing resources (CPU, RAM, GPU, and storage), and enter them in the form shown above. It may be helpful to know that Kubecost also accepts a CSV file to input custom pricing values. This feature is included in both the Business and Enterprise pricing tiers.
The two fields in the screenshot above related to Spot CPU and RAM pricing are only relevant if your Kubernetes cluster is hosted in a public cloud and using spot instances as cluster nodes.
Viewing Cost Allocation Dashboard
Once you access the user interface, the Cost Allocation dashboard is visibly present on the left navigation menu. This view allows you to select various grouping dimensions for allocating cluster costs. The screenshot in the example below shows costs allocated to each of the “Product” label values used in the cluster. Further down in this section, we explain how you can map Product (or Owner, Department) to your own custom labels.
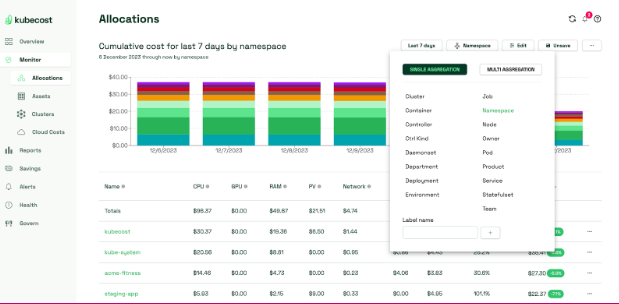
As you can see, the cluster costs are grouped by namespace as rows and broken by computing resources (CPU, RAM, GPU, storage, network) as columns. The column titled PV represents the storage cost of Persistent Volumes (PV), and the network costs include the data transfer costs to and from the internet or Virtual Private Network connections. The Shared costs may represent shared infrastructure services (such as a database cluster) used by all namespaces or a fixed overhead dollar value. The External cost may be made up of charges directly incurred by each namespace outside of the Kubernetes cluster, such as a database or blob storage dedicated to one namespace.
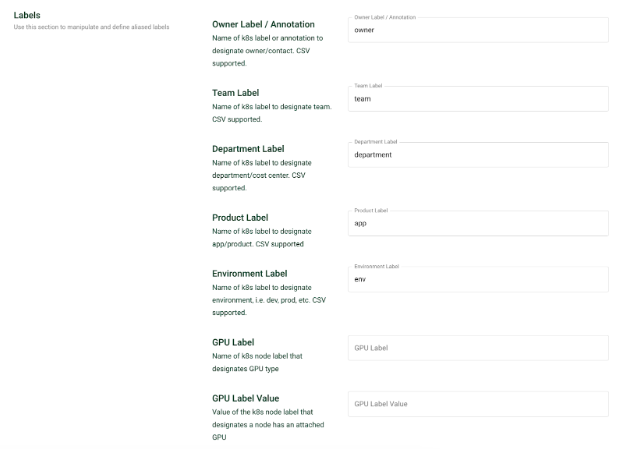
Note that the screenshot presented above shows a selector for grouping costs by various dimensions. Kubecost provides the ability to map custom labels to popular grouping dimensions (Owner, Team, Department, Product, Environment) based on labels. This mapping feature avoids polluting the grouping selector with too many label options that may be cryptic or irrelevant to end-users. This mapping (as presented below) is available on the General Settings page, accessible from the lower-left corner of the main page’s user interface.
Learn how to manage K8s costs via the Kubecost APIs
WATCH 30 MIN YOUTUBE VIDEOVisualizing Cloud Spend with Cost Explorer
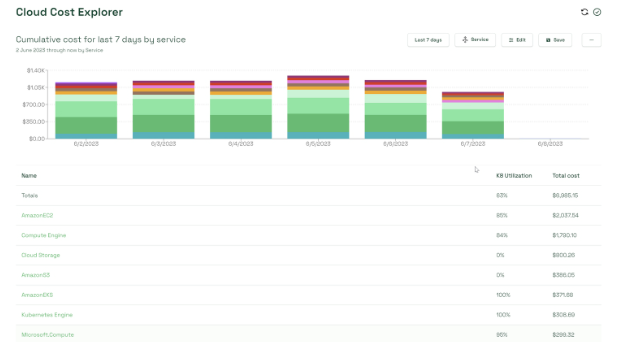
Integrating your Cloud Billing with Kubecost lets you visualize your cloud spending from the Kubecost UI. In the Monitor section, you can filter by asset and inspect the cost of your deployed resources by setting a time range and aggregating your cost by category. At the time of this writing, Supported fields are Workspace, Provider, Billing Account, Service Item, and custom labels. You can also view cost data over time or forecast data.
The following is an example view of the Cost Explorer, showing cloud spend over the last 7 days, displayed by asset type:
This is an example of a forecast chart:

Remember that to see this data, you must integrate your Cloud Billing with Kubecost.
Establishing spending limits for your Kubernetes resources with Budgets
Within the Govern section of the UI, you can create budgets to control your spending. The budgets can be set for clusters, namespaces, or labels (these are your workload types).
Budget caps can be set on a schedule (Weekly and Monthly) and reset on any day you choose, as shown below:
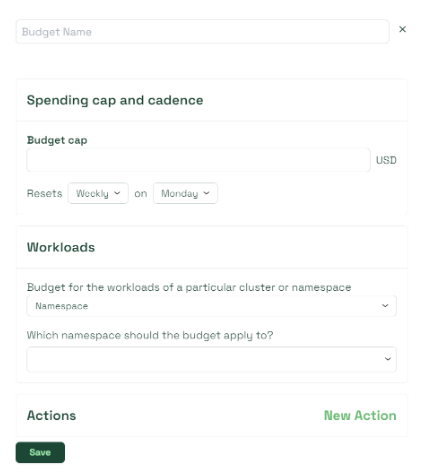
Actions can be configured to trigger alert messages to your email service or Slack for example.
Configuring Cost Alerts
As mentioned earlier in this article, Kubecost’s cost alerts help:
- Schedule a regular cost report (recurring update)
- Alert in case a daily spend exceeds a threshold (budget)
- Alert when a daily spend is above a historical moving average (spend change)
- Alert when cluster resources are under or over-provisioned (efficiency)
The screenshot below shows a form in the Kubecost user interface accessible on the left-hand main navigation menu under a section titled “Alerts”. You may enter a threshold for daily spending in this form and receive an alert notification if your actual usage exceeds your daily budget threshold. This feature helps stop an overrun right when it starts and before it goes unnoticed for weeks.
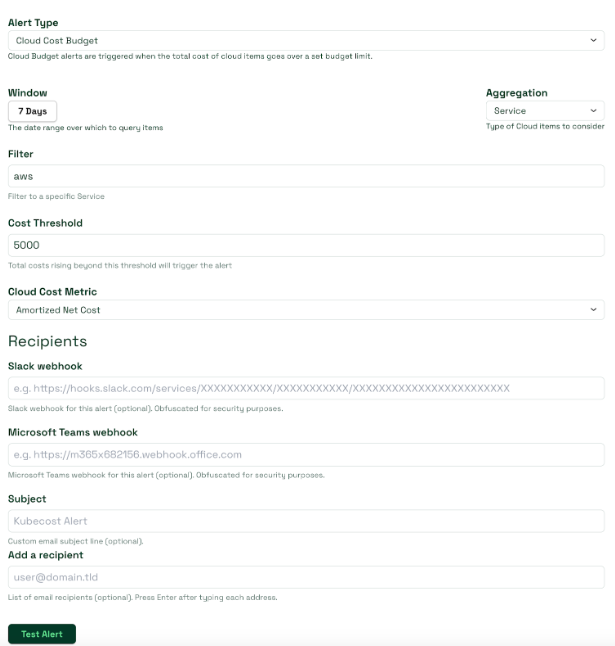
The notification of a spending overrun alert may be in the form of an email, a Slack message (as shown below), or a Webhook (for easy integration into third-party tools such as PagerDuty, for example).
Via Email
 Kubecost Email Notification
Via Slack
 Kubecost Slack Notification

Comprehensive Kubernetes cost monitoring & optimization
Conclusion
A public cloud provider meters the costs of a hosted Kubernetes cluster so you can know your exact hourly spending and stop it when you would like. On the other hand, the sunk cost of a node supporting an on-premises cluster is more complicated to calculate but possible to estimate using the method proposed in this article. Once you estimate the value of an on-premises Kubernetes node, Kubecost can help you monitor your cluster’s costs with cost allocation reports, cost alerts, and health checks. Kubecost’s functionality allows you to safely strike a perfect balance between your cluster’s performance and cost.