Integrate Kubecost with Datadog
Learn how to extract, transform and load real-time Kubecost metrics into Datadog and visualize with a Datadog dashboard.
Overview
Since its founding in 2019, Kubecost has helped thousands of teams unlock granular, real-time visibility of Kubernetes spending and efficiency. Kubecost is built on OpenCost, which was recently accepted as a Cloud Native Computing Foundation (CNCF) Sandbox project. By offering richer features, Kubecost Enterprise provides Kubernetes cost visibility, optimization, and governance features such as saving recommendations, cost prediction, or cost audit, setting up budget rules, unified multi-cluster views, and more. You can learn more at this documentation
Datadog is a monitoring and security platform which teams use for cloud applications or cloud monitoring as a service. Many teams which have adopted Kubernetes to modernize their infrastructure leverage Datadog as their observability platform to track, analyze and display performance metrics to monitor the health of their containerized infrastructure. However, there are challenges to having granular insights into the costs of the Kubernetes clusters, such as the aggregated costs by namespace, deployments, or at the container level.
In this article, you will learn how to leverage Kubecost to get the onDemand cost allocation data visualized in a Datadog dashboard. You can use onDemand cloud provider rates or custom rates for real-time monitoring purposes with your existing Datadog setup.
Architecture
By default, Kubecost emits cost allocation metrics (unaggregated, unreconciled) in a Prometheus-compatible format with cloud providers via the /metrics endpoint. You can install Kubecost with additional annotations in cost-model pods, which allows the Datadog agent to look into the /metrics endpoint, map Prometheus-compatible metrics to the Datadog-compatible metrics, then push the metrics to your Datadog account.
Instructions
Installing Datadog agent
When installing your Datadog agent, you need to enable these flags to allow the Datadog agent to collect the metrics from Kubecost’s cost-model container:
datadog.prometheusScrape.enabled='true'datadog.prometheusScrape.serviceEndpoints=true'
Use the following commands to install the Datadog agent:
Step 1: Set up your Datadog API key as an environment variable. You can get the API key from this link after login to your Datadog account.
export DATADOG_API_KEY="<YOUR_API_KEY>"
Step 2: Install Datadog agent with your API key
helm repo add datadog https://helm.datadoghq.com
helm upgrade -i datadog-agent datadog/datadog \
  --set datadog.site='us5.datadoghq.com' \
  --set datadog.apiKey=$DATADOG_API_KEY \
  --set datadog.prometheusScrape.enabled=‘true’ \
  --set datadog.prometheusScrape.serviceEndpoints=‘true’
Installing Kubecost
Install Kubecost using the following command to allow the Datadog agent to collect the metrics:
helm upgrade --install kubecost --namespace kubecost --create-namespace \
  --repo https://kubecost.github.io/cost-analyzer/ cost-analyzer \
  -f https://tinyurl.com/kubecost-datadog-values \
  --set kubecostToken="aGVsbUBrdWJlY29zdC5jb20=xm343yadf98"
Allow 3-5 minutes to have the Kubecost installation completed, at which point the metrics are pushed into your Datadog account. Run the following command to enable port-forwarding and expose the Kubecost dashboard:
kubectl port-forward --namespace kubecost deployment/kubecost-cost-analyzer 9090
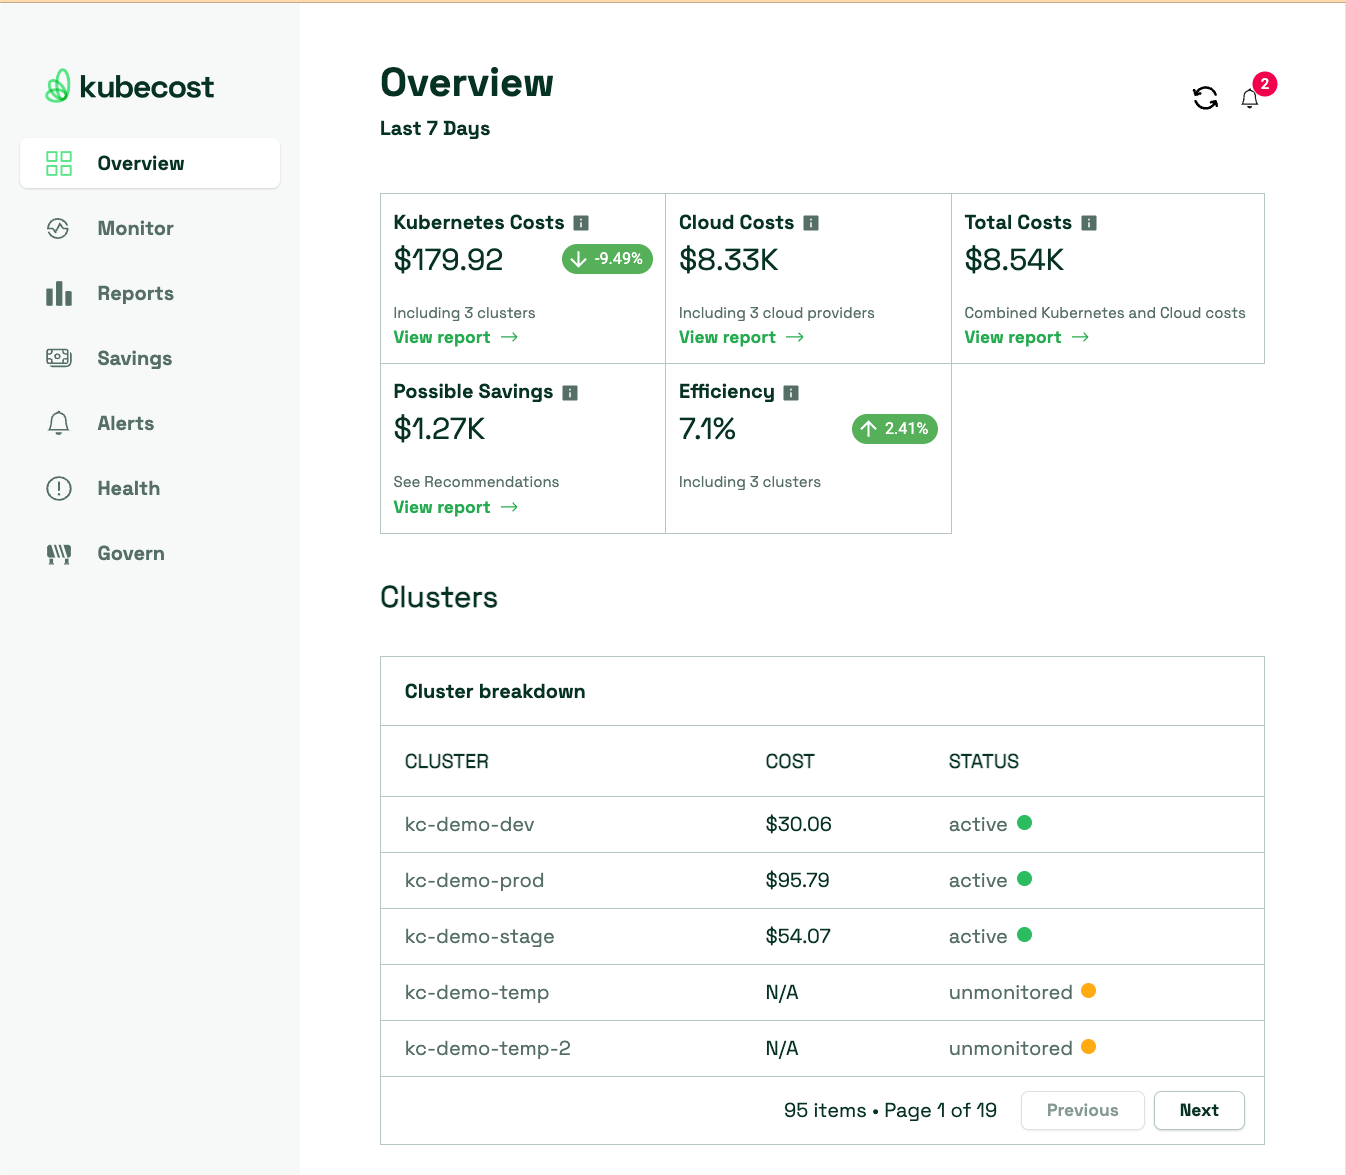
You can now access the Kubecost dashboard by navigating to http://localhost:9090 on your web browser. The following screenshot shows an example of our Kubecost UI:
Next, you can verify if the metrics are available by using Datadog Metrics explorer and looking for metrics starting with kubecost.*
Importing Kubecost Dashboard
Once you verify that Kubecost metrics are pushed into your Datadog account, you can download our example Datadog dashboard Kubecostdashboard.json and import it into your Datadog account to visualize the Kubecost cost allocation data.
wget https://raw.githubusercontent.com/kubecost/poc-common-configurations/main/datadog/Kubecostdashboard.json
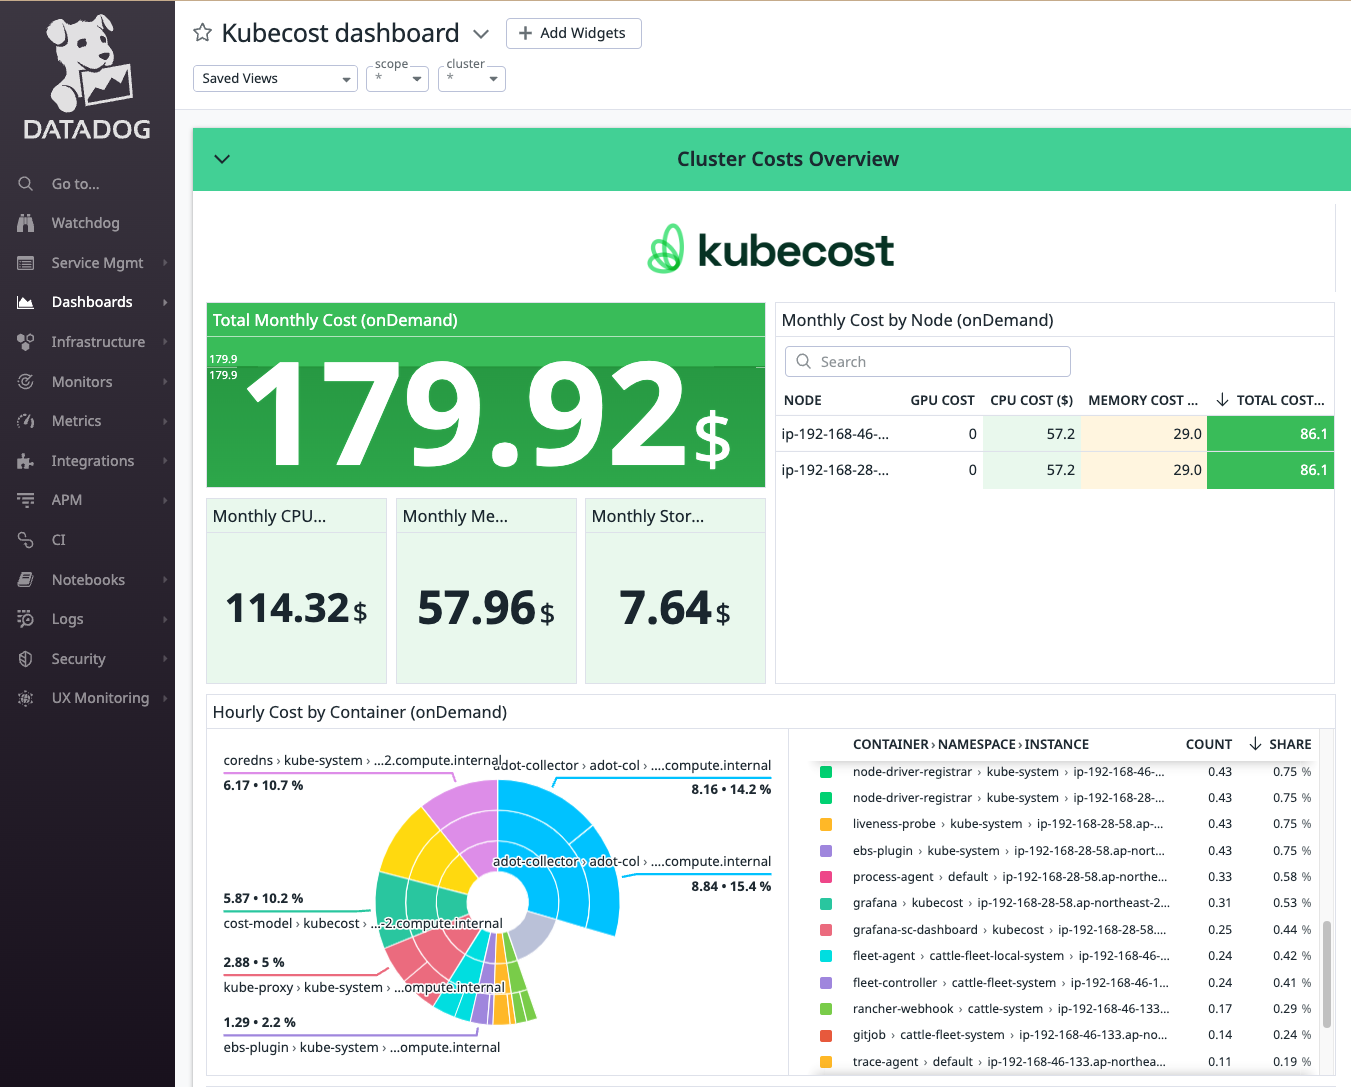
Check this Datadog documentation to learn how to import dashboard JSON. The example dashboard gives you the overview of your cluster’s monthly cost and the costs at more granularity levels such as containers or namespaces.
The following screenshot shows you what the dashboard looks like in a demo environment:
Conclusion
You have learned how to extract, transform and load real-time Kubecost metrics into Datadog and visualize the data on a Datadog dashboard. You can find more information in our documentation here. As always, you can provide feedback on our github repository, or if you have any questions, you can contact us on Slack or email at team@kubecost.
To participate in our free Enterprise onboarding program, email us at support@kubecost to schedule these sessions!