Prometheus Grafana: Best Practices with Examples

Introduction
A robust performance monitoring and alerting stack is crucial to service reliability. Cloud Native Computing Foundation-graduated Prometheus is one of the most popular and powerful monitoring frameworks for cloud-native projects. It offers its own time-series database to store metrics, supports a variety of exporters for monitoring services like MySQL, Kubernetes, and Kafka, and includes granular and flexible alerting.
While Prometheus is an excellent performance monitoring tool, its data visualization capabilities are limited. Therefore, teams often combine Prometheus with Grafana. Grafana is an open source metrics analytics tool from Grafana Labs, creators of Grafana Cloud, that works with multiple data sources, including the Prometheus time-series database.
The Prometheus Grafana combination has become one of the most popular solutions for performance monitoring, alerting, and visualization in the cloud-native space. In this article, we’ll take a closer look at the Prometheus Grafana solution, and how it works, and walk through real-world examples to help you gain hands-on experience with these powerful DevOps tools.
The Prometheus Grafana monitoring stack overview
Let’s begin with a look at the high-level features of Prometheus and Grafana.
Prometheus highlights
Key features that make Prometheus such an effective performance monitoring and alerting solution are:
- Automatic discovery of metric targets
- Metric aggregation based on a pull model
- Multi-dimensional data model
- Supports single server mode, no distributed storage requirement
- A single pane of glass with the recently-released “agent mode”
- PromQL, a powerful Prometheus query language for accessing Prometheus system metrics
Prometheus PromQL
PromQL, Prometheus query language, a key component of working with Prometheus. The PromQL expression language supports 4 data types.
| Instant Vector | A set of time series containing a single sample for each time series, all sharing the same timestamp |
| Range Vector | A set of time series containing a range of data points over time for each time series |
| Scalar | A simple numeric floating-point value |
| String | A simple string |
PromQL operators for querying
| Arithmetic Binary | - , - , * , / , % , ^ |
| Comparison Binary | == , != , > , < , >= , <= |
| Logical Binary | and , or , unless |
| Vector Matching | group_right group_left |
| Aggregation Operators | sum, min , max , avg, quantile, count, etc. |
Common PromQL functions
Functions help reduce the need to use multiple operators in queries. The table below details the different query functions PromQL supports.
| Returns the scalar as a vector with no labels | |
| The calculated per-second average rate of increase of the time series data in the range vector | |
| The increase in time series data in the range vector | |
| The number of seconds since January 1, 1970 UTC | |
| The difference between the first and last value of each time series element | |
| Aggregates each series of a given range vector over time and returns an instant vector with per-series aggregation results, used with the sum, avg, min, max, count and more |
Grafana highlights
Key features that make Grafana a powerful tool for observability and visualization are:
- Dashboard templating allows you to create reusable dashboard templates and store them in Git. A CI/CD pipeline can then consume these to pre-configure Grafana
- Threshold-based alerting allows you to configure and deliver alerts based on metric thresholds. Grafana supports all major alert delivery options, including Pagerduty, Opsgenie, or Slack.
- Kiosk mode allows Gafana to display business-critical dashboards across multiple screens.
- Granular access management features allow you to restrict users to relevant dashboards only.
- A dynamic plugin library helps make it easy to design and customize dashboards.
- Support for multiple data sources means Grafana can easily integrate into many environments.
How to configure the Prometheus Grafana combination
Now that you know the basics, let’s walk through how to set up a Prometheus Grafana stack. In this section we provide instructions for both a Docker-based installation and a Kubernetes based installation using a Helm chart.
Docker-based Installation
For this tutorial, we’ll use Docker 20.10.7, but other recent versions of Docker should also work.
1. To get a local instance of Prometheus running using Docker, run this command.
$ docker run -it -p 9090:9090 prom/prometheus
2. You should see output similar to the following.
ts=2022-01-08T22:43:07.643Z caller=main.go:478 level=info msg="No time or size retention was set so using the default time retention" duration=15d
ts=2022-01-08T22:43:07.644Z caller=main.go:515 level=info msg="Starting Prometheus" version="(version=2.32.1, branch=HEAD, revision=41f1a8125e664985dd30674e5bdf6b683eff5d32)"
...
...
...
ts=2022-01-08T22:43:07.654Z caller=main.go:1129 level=info msg="Loading configuration file" filename=/etc/prometheus/prometheus.yml
ts=2022-01-08T22:43:07.656Z caller=main.go:1166 level=info msg="Completed loading of configuration file" filename=/etc/prometheus/prometheus.yml totalDuration=1.521078ms db_storage=678ns remote_storage=1.302µs web_handler=361ns query_engine=735ns scrape=622.197µs scrape_sd=32.57µs notify=50.705µs notify_sd=9.968µs rules=2.172µs
ts=2022-01-08T22:43:07.656Z caller=main.go:897 level=info msg="Server is ready to receive web requests."
3. Now, you should be able to access the Prometheus UI at http://localhost:9090.
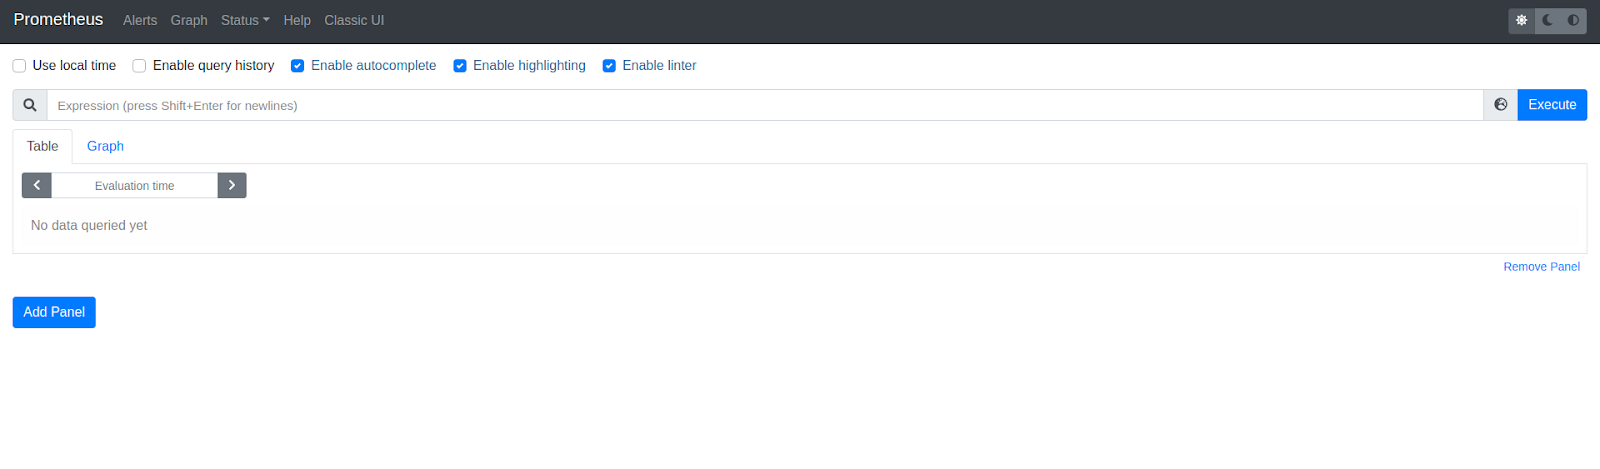
Prometheus UI Graph View
4. You can view the Prometheus Configuration at http://localhost:9090/config.
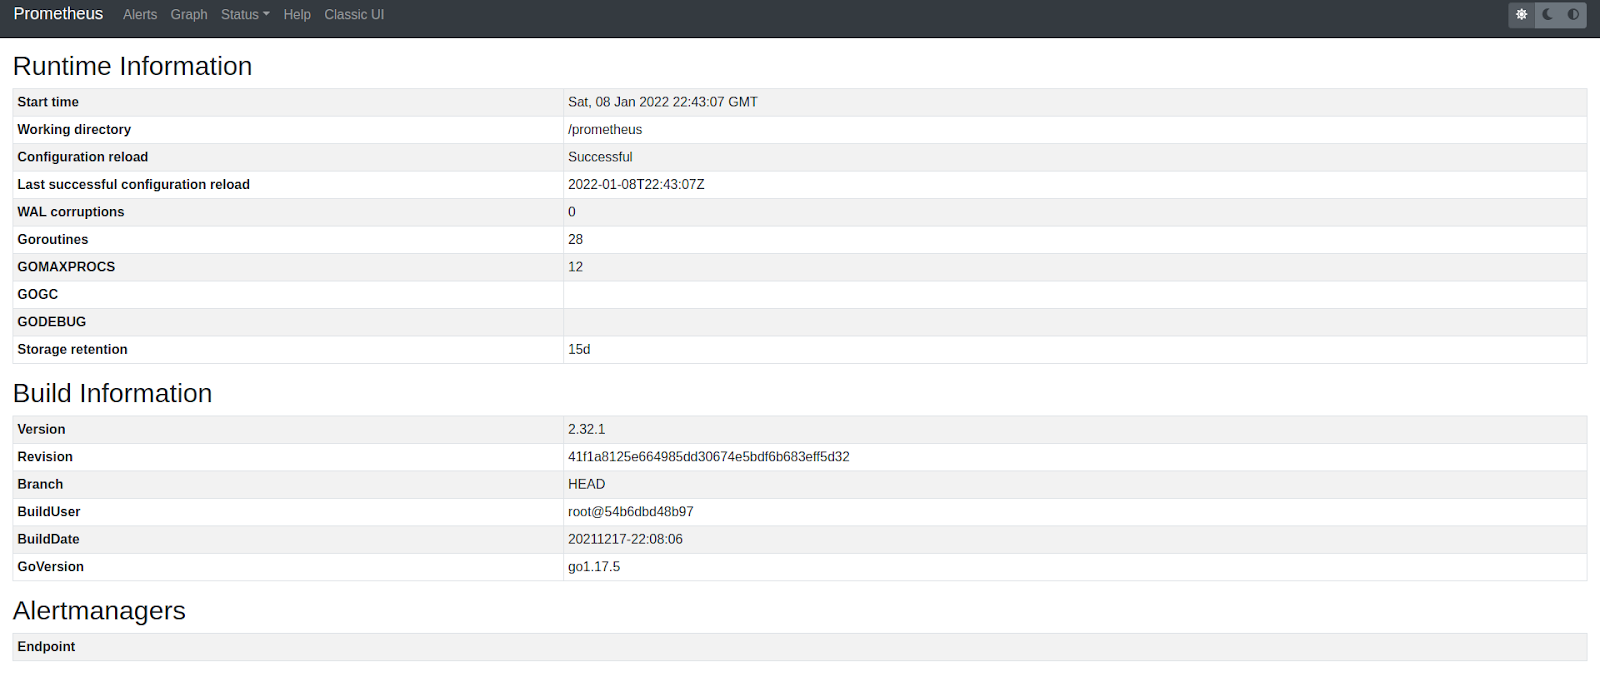
Prometheus UI Status View
Since this is a local server, you won’t see any targets. When you deploy a Prometheus instance in a Kubernetes cluster, you will discover many targets.
5. The targets endpoint is available at http:///targets.
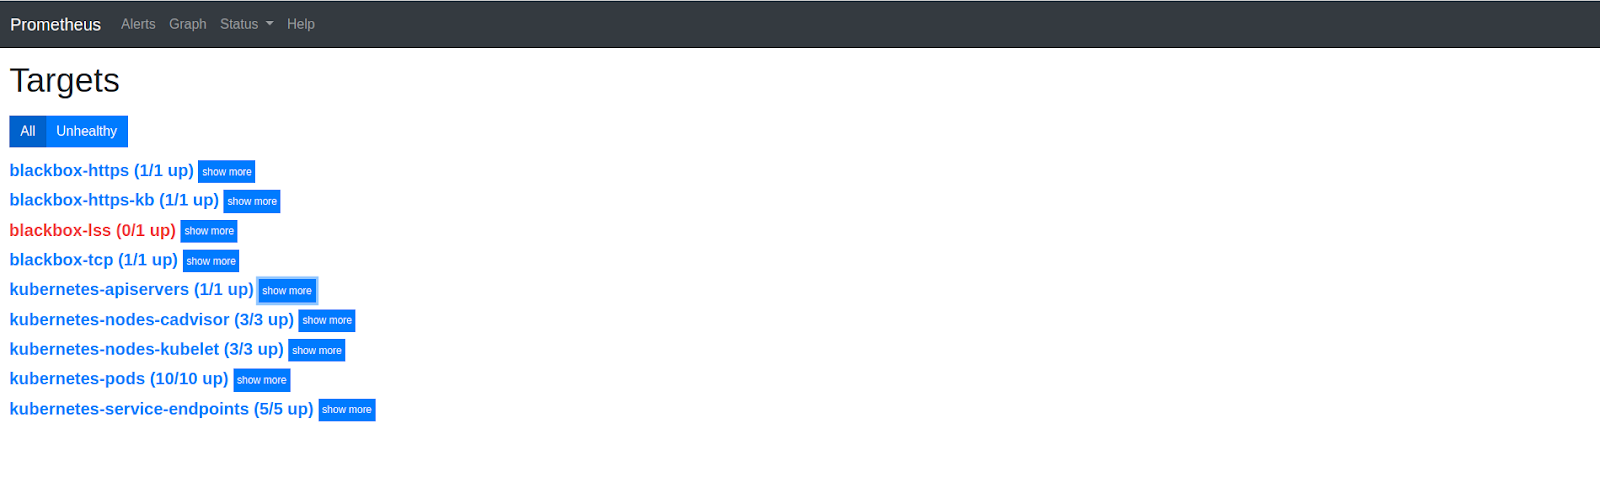
Prometheus Targets View
Now that you are up and running with Prometheus, let’s get started with Grafana. You can also run Grafana locally using Docker as soon as the instance comes up.
6. To begin, run Grafana with this command.
docker run -it -p 3000:3000 grafana/grafana
7. Browse to the Grafana UI at http://localhost:3000.
8. Navigate to Data Sources under the Configuration tab.
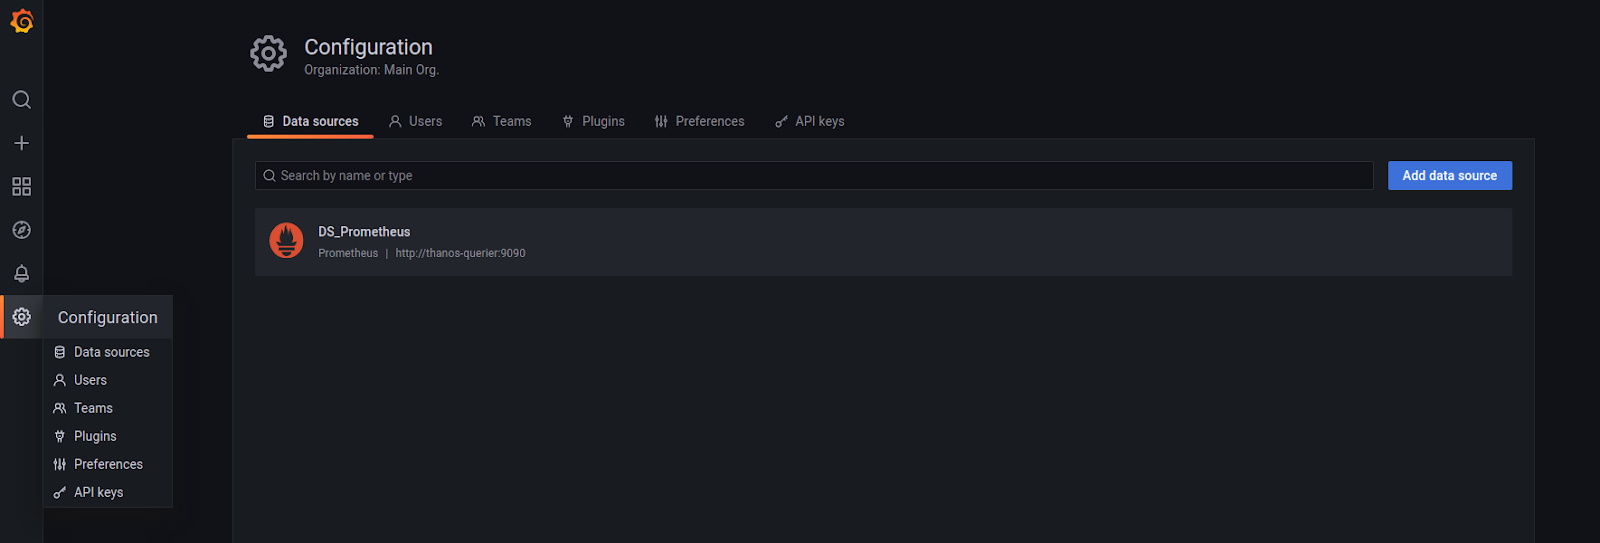
9. Click on Add Data Source and choose Prometheus to add as a new data source.
10. Under the Server, enter http://localhost:9090, and you should be able to connect to the local Prometheus server.
These manifests can help you further configure your Prometheus Grafana installation for production environments.
Kubernetes-based installation
Prometheus and Grafana offer first-class support for Kubernetes. Setting up Prometheus and Grafana is a breeze using helm. The kube-prometheus-stack helm chart is one the most popular ones.
1. To get started, run the following commands.
$ helm repo add prometheus-community https://prometheus-community.github.io/helm-charts
$ helm repo update
$ helm install prometheus-stack prometheus-community/kube-prometheus-stack -n monitoring
These commands should install the Prometheus Grafana stack along with some Prometheus exporters in the monitoring namespace.
2. Take a quick look at all the services running.
$ kubectl get service -n monitoring

NAME                                        TYPE        CLUSTER-IP       EXTERNAL-IP   PORT(S)                      AGE

alertmanager-operated                       ClusterIP   None             <none>        9093/TCP,9094/TCP,9094/UDP   10m

prometheus-operated                         ClusterIP   None             <none>        9090/TCP                     10m

prometheus-stack-grafana                    ClusterIP   10.105.244.221   <none>        80/TCP                       11m

prometheus-stack-kube-prom-alertmanager     ClusterIP   10.97.172.208    <none>        9093/TCP                     11m

prometheus-stack-kube-prom-operator         ClusterIP   10.97.94.139     <none>        443/TCP                      11m

prometheus-stack-kube-prom-prometheus       ClusterIP   10.105.123.218   <none>        9090/TCP                     11m

prometheus-stack-kube-state-metrics         ClusterIP   10.96.52.8       <none>        8080/TCP                     11m

prometheus-stack-prometheus-node-exporter   ClusterIP   10.107.204.248   <none>        9100/TCP                     11m
3. In order to access the Prometheus UI, run the following.
$ kubectl -n monitoring port-forward svc/prometheus-stack-kube-prom-prometheus 9090:9090
4. And then navigate to http://localhost:9090.
Similarly, Grafana can be accessed by port-forwarding to the relevant service. The helm chart offers many other options that you can tweak to your liking in the values file.
Prometheus & Grafana
As you can see, a basic Prometheus & Grafana configuration is straightforward. However, there are several best practices to keep in mind when using Prometheus and Grafana in production.
Best Practices
- High availability: Prometheus does not provide High Availability (HA) out the box, but we can achieve HA by clustering it with Thanos or using a storage-backed solution like Cortex.
- Long-term metric storage: In production environments, it is good to use persistent disks to store metric data. However, long-term metric retention on disks is very costly and not scalable. Both Thanos and Cortex provide the ability to archive metric data in some kind of blob storage such as Google Cloud Platform’s (GCP) GCS buckets or S3 provided by Amazon Web Services (AWS).
- Scalability: Prometheus is a stateful service, and it is not straightforward to scale it horizontally. However, both Cortex and Thanos have metrics deduplication capabilities, and therefore you can scale Prometheus horizontally to scrape the same targets without worrying about duplicate metrics.
- Single pane of glass view: Modern infrastructure is not limited to a particular cloud or technology. It could comprise VMs, Kubernetes clusters, on-prem environments, serverless, etc. Prometheus can help create a single pane of glass view to monitor all these services. Until recently, we used Thanos or Cortex as the preferred way to achieve this. However, Prometheus documentation has recently announced support for agent mode. In this mode, a Prometheus server would scrape targets and then write metrics to a remote Prometheus instance. We can then query this instance for metrics from different clusters and get a single pane of glass view for all our metric data.
- Target discovery: Prometheus has native support for all cloud providers and cloud-native technologies such as Kubernetes. However, adding individual scrape targets to the Prometheus configuration is not scalable. It is best to leverage automated target discovering capabilities such as using annotations in the case of Kubernetes.
- User management: Developers and other stakeholders should hardly ever need direct access to Prometheus. DevOps teams should leverage Grafana’s user management capabilities to create Teams and then grant access to each Team which automatically propagates to the team members.
- Alert management: A Prometheus-only setup uses Alertmanager for alert delivery. However, Grafana’s alerting features are much more advanced and easy to use. It has integrations with all significant notification channels like Slack, Pagerduty, etc.
- Integrations. The Prometheus ecosystemg is made rich by a long list of exporters. The community has created Prometheus exporters for cloud providers, databases, APIs, etc. You can find a list of all available exporters here.
Prometheus & Kubecost
Prometheus is also a data source of other tools such as Kubecost. Kubecost leverages Prometheus to gather utilization metrics (such as CPU, memory, GPU, storage, network) and uses it to provide data visualization and insights into the efficiency, cost, and health of the services running in your Kubernetes cluster.
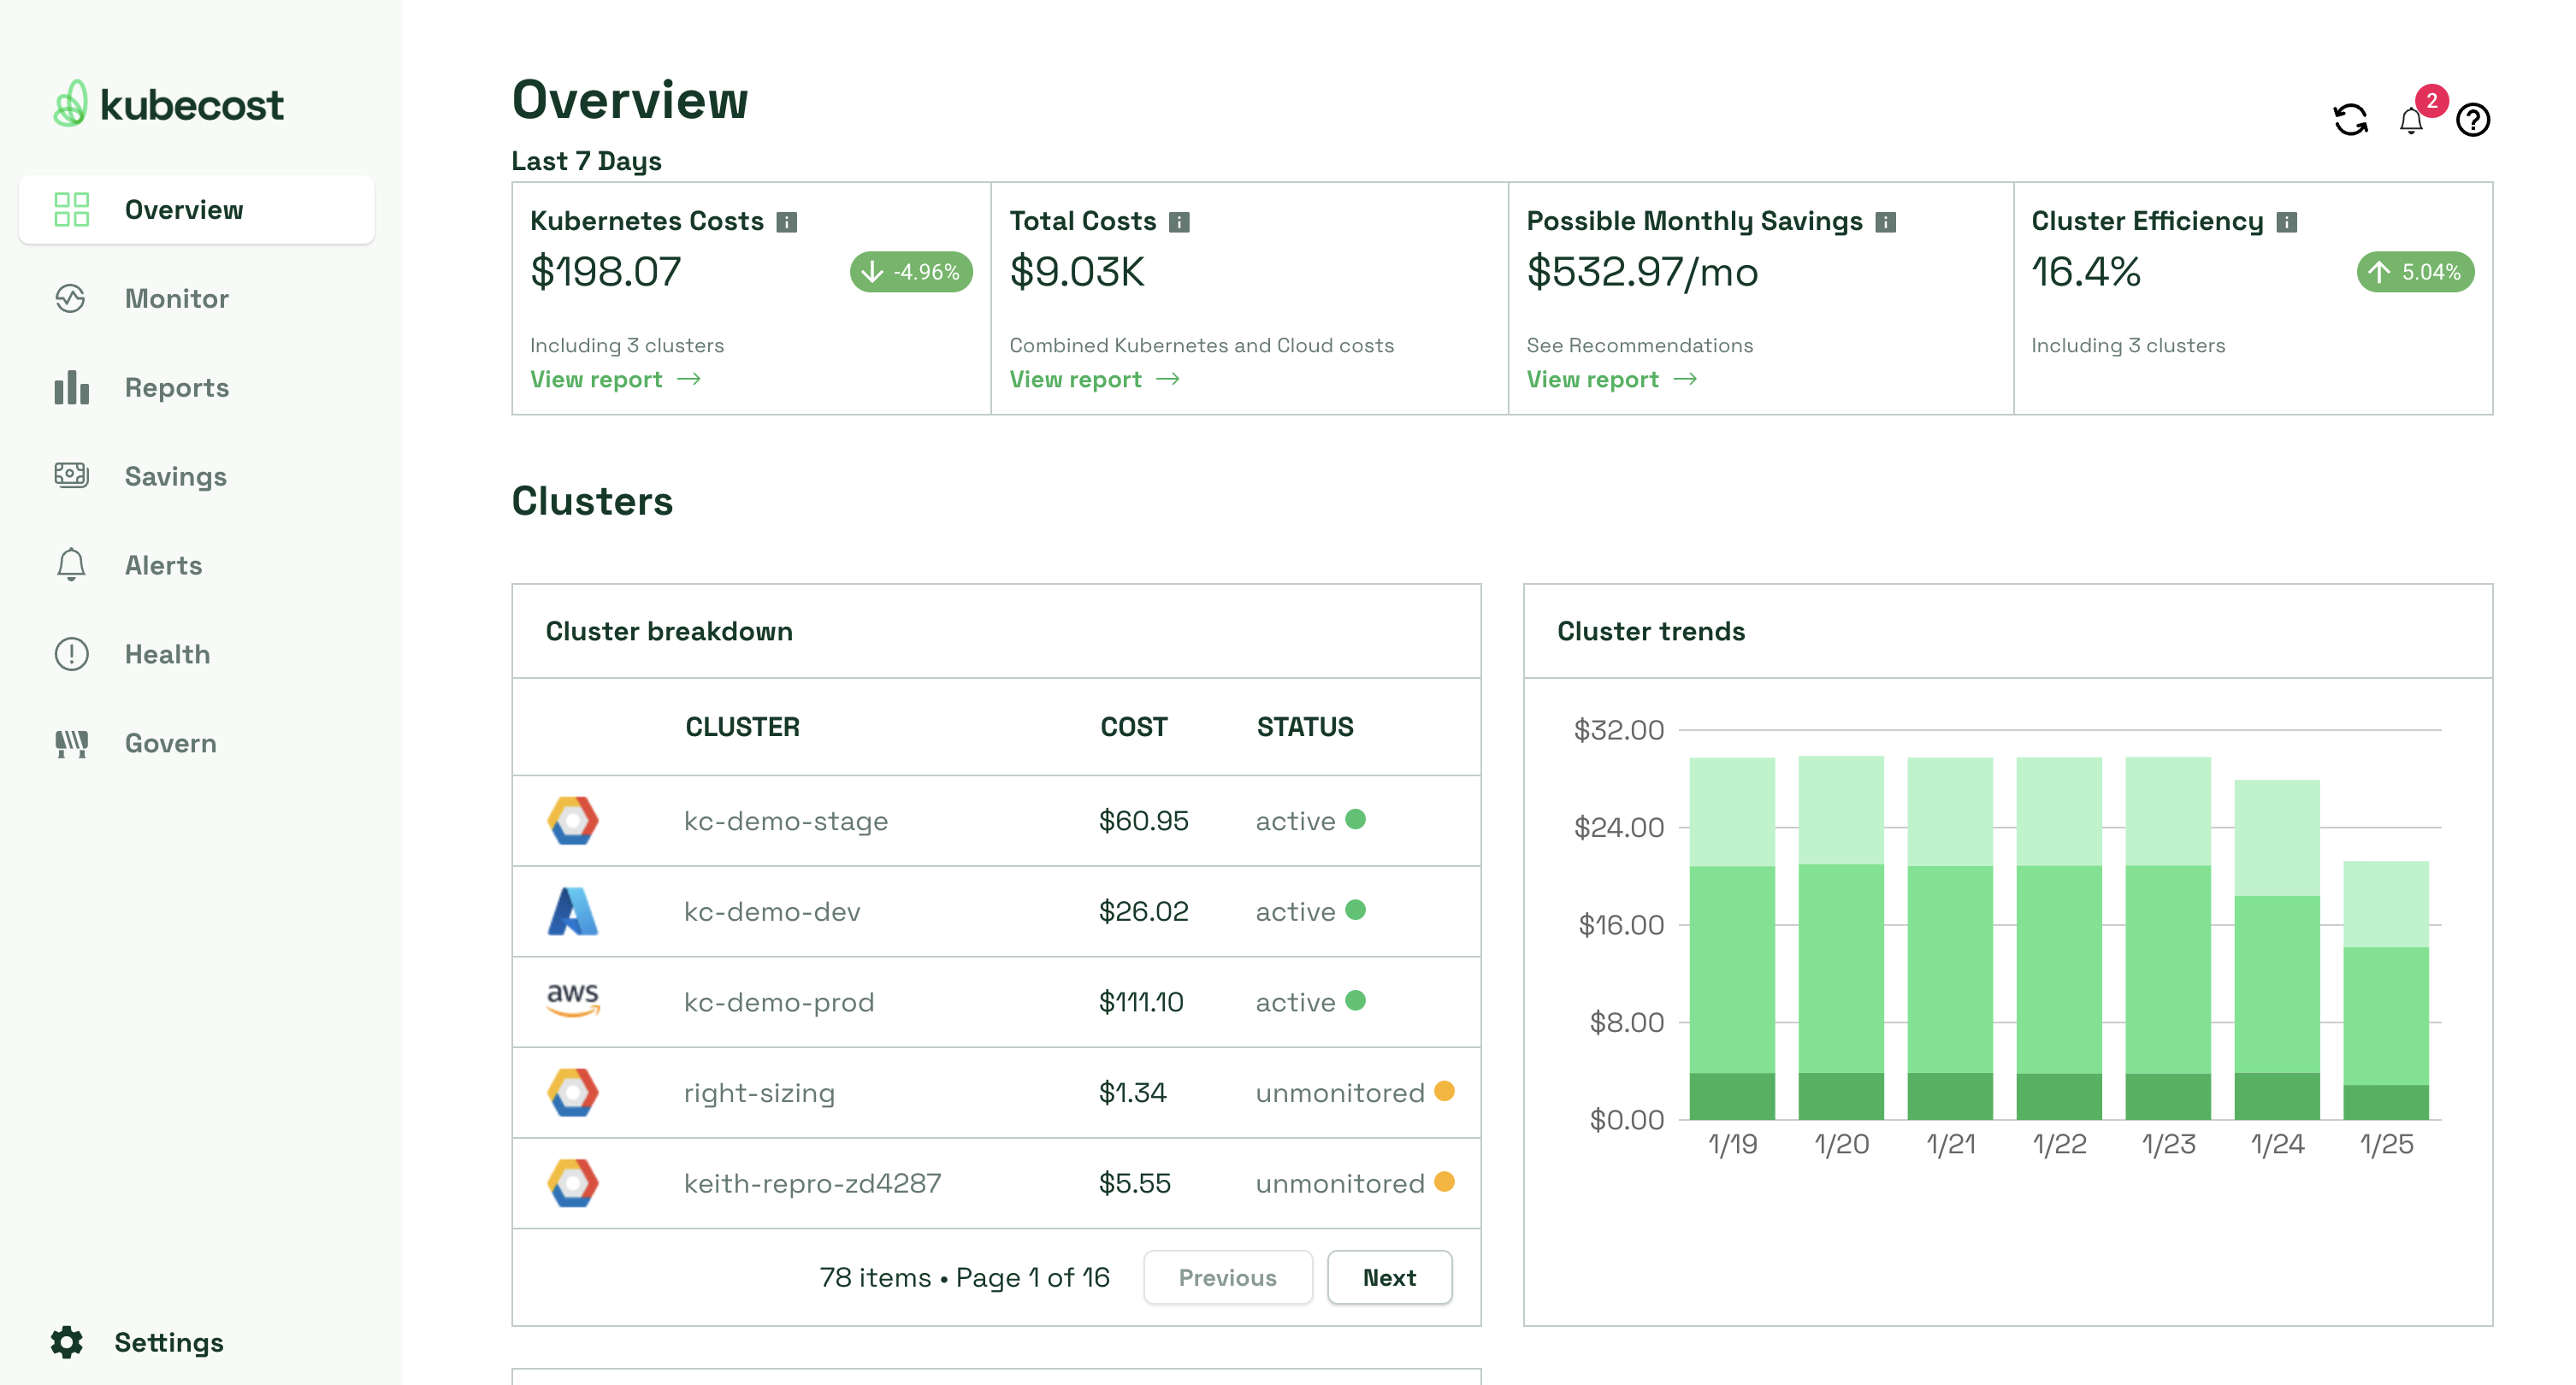
Kubecost main dashboard summarizes K8s costs, efficiency, and health
Kubecost cross-correlates the usage statistics with cost data gathered from the billing records of public cloud providers (while also supporting on-premise implementations of Kubernetes) and allocates the costs across all Kubernetes resources such as namespaces, DaemonSets, pods, and even labels. The results are available in the form of dashboards and reports. The Kubecost alerts notify administrators of a sudden drop in efficiency or capacity headroom or detect a budget overrun.
You can download it here and use it for free forever on one cluster.
Conclusion
A Prometheus and Grafana monitoring stack is a must for cloud-native application infrastructure environments. Prometheus has a wide variety of open source integrations and is a part of various other tools. But we must keep the best practices discussed above in mind when operating a production-grade monitoring stack on a large scale.
About Kubecost
Stackwatch is the creator of Kubecost, along with OpenCost, an open source cost monitoring tool donated to the Cloud Native Computing Foundation. Kubecost provides cost observability, data visualization, and capacity management tools purpose built for Kubernetes. We provide teams with the insights needed to help continuously reduce cloud costs. Reach out via email (team@kubecost), Slack or visit our website if you want to talk shop or learn more!
We’re hiring!
We are always interviewing engineers, and we are also increasingly looking for new hires in non-technical roles in which you could have a huge impact steering the direction of the company’s growth.
Check out our open roles to learn more!