Real-time Kubernetes cost management alerts
Engineering teams can scale their Kubernetes costs and burn their budget with the same ease with which they scale their infrastructure. Thanks to Kubecost real-time alerting, the risk of upsetting the finance team can be mitigated. Kubernetes is well-known for its ability to easily and rapidly help scale applications, but this ability comes with some tradeoffs. Before Kubernetes, teams had to follow a more deliberate procurement approval process to change the capacity allocation. Today, that scaling process has been democratized, and teams can easily scale their clusters up or down.
With the ability to create more frequent changes to infrastructure resources comes more opportunities to misallocate and over-allocate costly resources. In this model, technical teams can far exceed their expense budget without even realizing it, while financial managers would only notice it after the fact leading to avoidable organizational stress. So, how do you stay on top of your Kubernetes spending if your resources change daily?
In this article, we’ll look at how Kubecost alerting provides real-time updates on your budget, spending changes, and any opportunities for cost optimization. But before we dive into Kubecost, let’s talk about alerts.
Why alerting is essential
In ecosystems where a single platform supports multiple services, it’s crucial to give all stakeholders the ability to track their individual services. This level of visibility requires allocating resource usage and cost to each service within a shared cluster. This clear ownership improves budget-based resource planning, identifies resource bottlenecks, and even helps manage security risks. Once your ecosystem is properly organized, the next step toward clarity is to set up cost alerts.
Cost alerts help your organization avoid shocking cloud bills. And while global alerts on budget use or spending changes across an entire Kubernetes cluster might broadly improve your spend awareness, they are often not as helpful to service or application owners unless they track the allocated cost of their particular service.
For example, say you are running a single GKE cluster spanning 50 nodes with the ability to scale to 150. This cluster hosts many applications, each belonging to a different team. Calculating the cost of the entire cluster is a straightforward process using the GCP Pricing Calculator. However, doing so won’t be useful for calculating the cost incurred separately by each application according to usage. It also cannot alert a service owner when the cost of running that service exceeds their budget of, say, $10,000 per month.
Direct Expenses Have Direct Impacts
How does an application service owner know if their service is making money or losing money for the company?
Let us answer this question in an accounting context. Cloud hosting costs such as Kubernetes infrastructure are considered a “direct expense” (or cost of sales) for an application service provider, which determines its gross margin. So your hosting costs associated with a production environment must be allocated to each application service (or at least to each department or business unit) to know if the service is priced correctly to produce a sufficient level of gross margin.
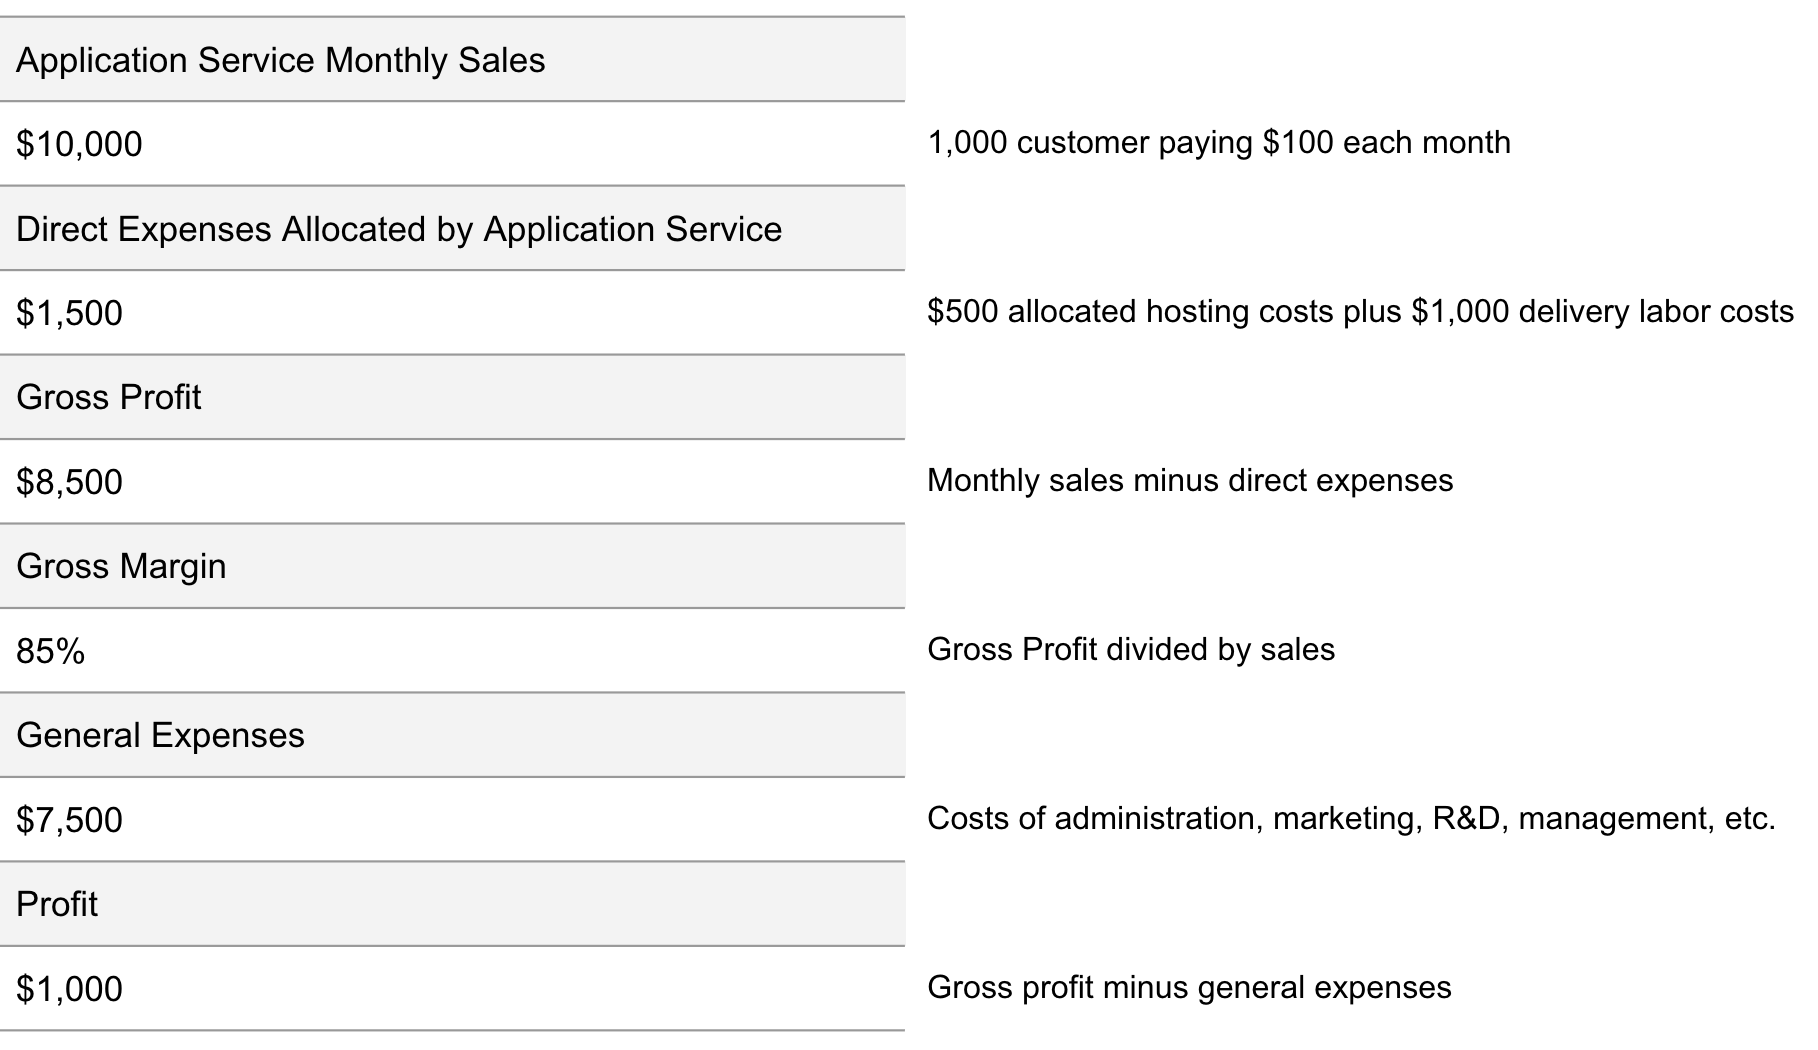
A simplified pricing exercise would look like this:
- Calculate your cost of sales (add all direct service delivery expenses).
- Calculate your service’s gross profit (sales minus cost of sales).
- Calculate your actual gross margin (gross profit divided by sales).
- Set a target gross margin (as a percentage such as 85%).
- Determine what pricing (set by application owners) achieves your target gross margin (once your direct expenses are as efficient as possible).
- Set monthly budgets for your expenses relative to your projected sales.
 |
|---|
| Profitability analysis by application service |
Once hosting costs are allocated to application services (or cost centers or teams), then cost alerts help each application owner (or team) enforce their own budget on a daily basis to maintain their target gross margin.
An absence of cost alerts can lead to:
- Inadvertent overspending
- Inefficient infrastructure use
- Under-pricing of your services
- Poor visibility for business planning

Comprehensive Kubernetes cost monitoring & optimization
How Kubecost Adds Clarity
Two of the key features of Kubecost are its cost allocation views for granular insights and its notifications triggered by cost alerts.
1. Granular Insights
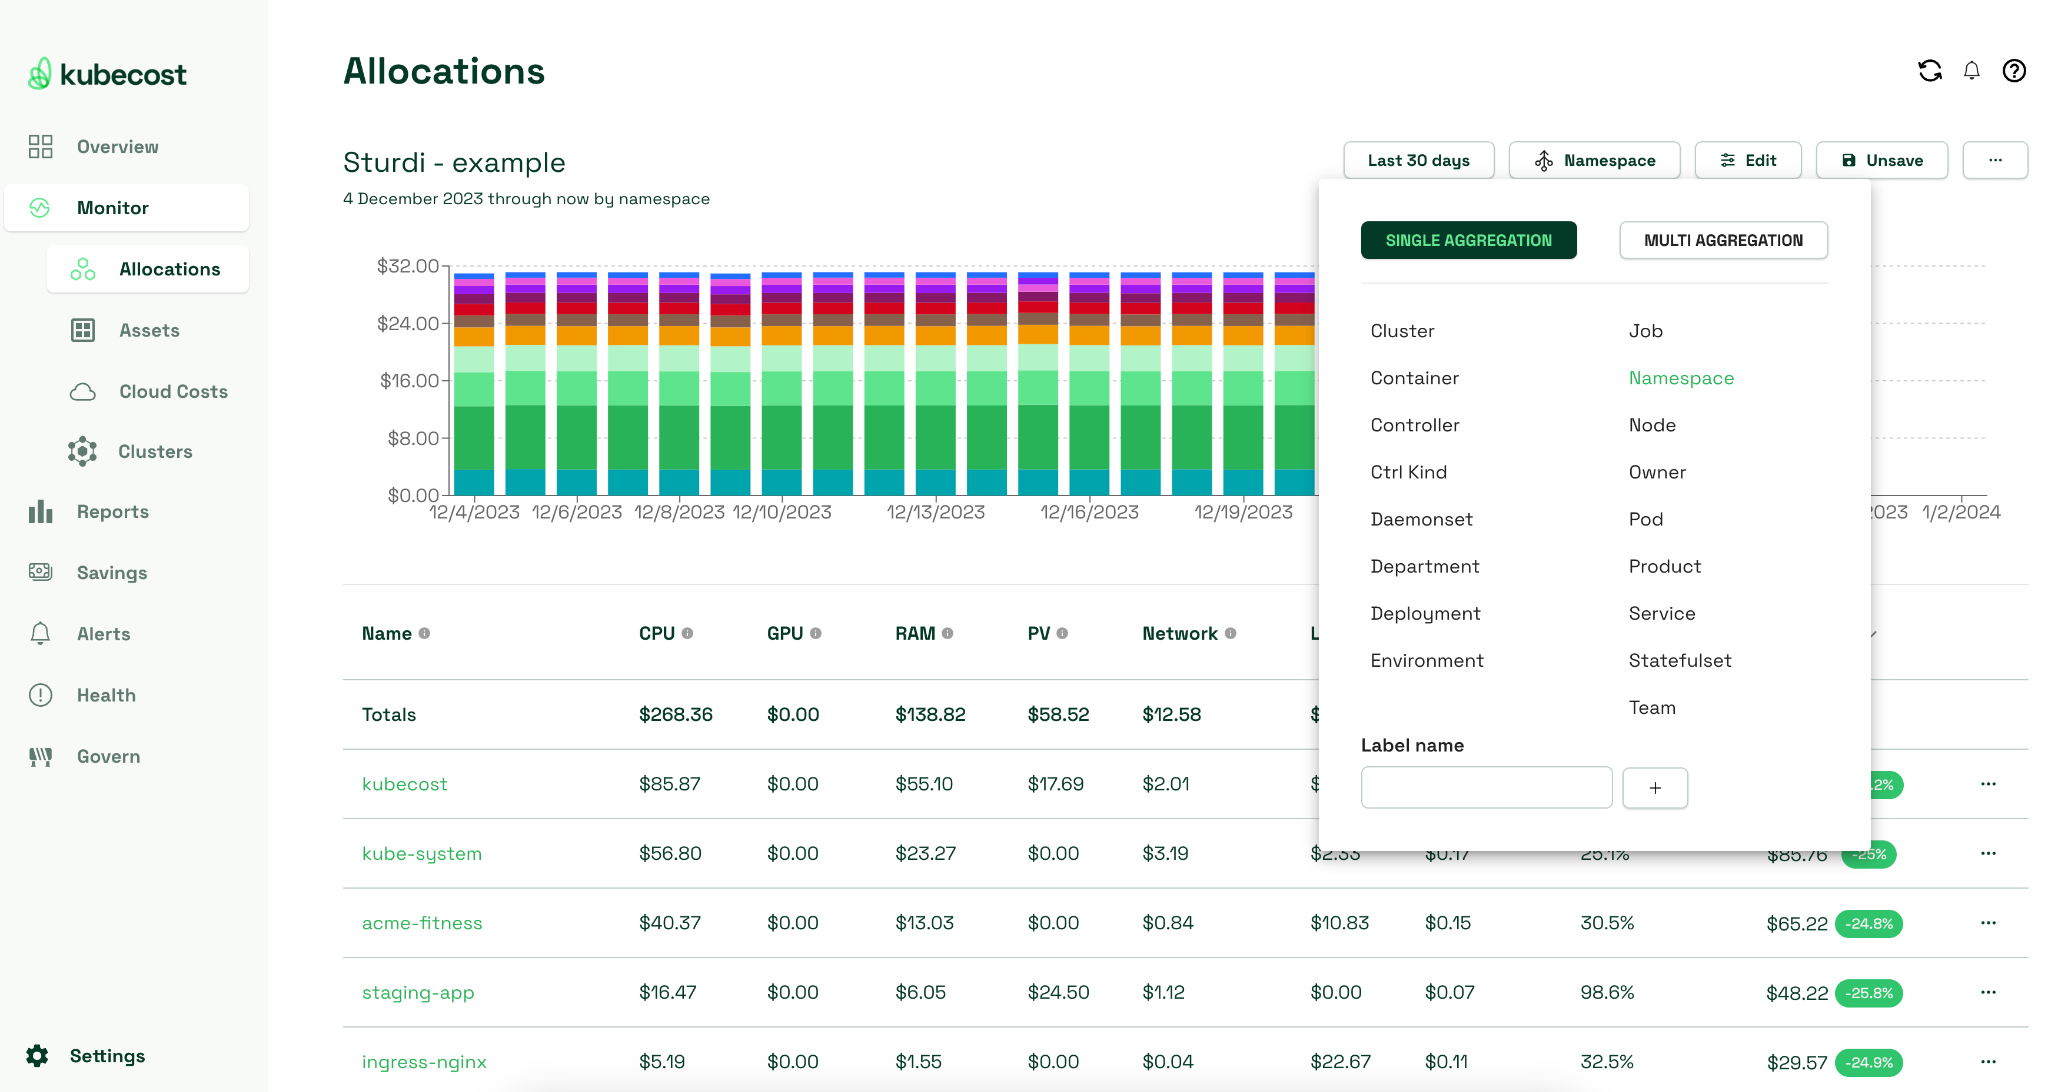
Kubecost can break costs down to any Kubernetes component level (according to usage), down to individual workloads. The cost allocation model supports all native Kubernetes concepts, including cluster, namespace, controller, deployment, service, label, pod, and container.
 |
|---|
| Bird’s eye view of overall cluster cost usagee |
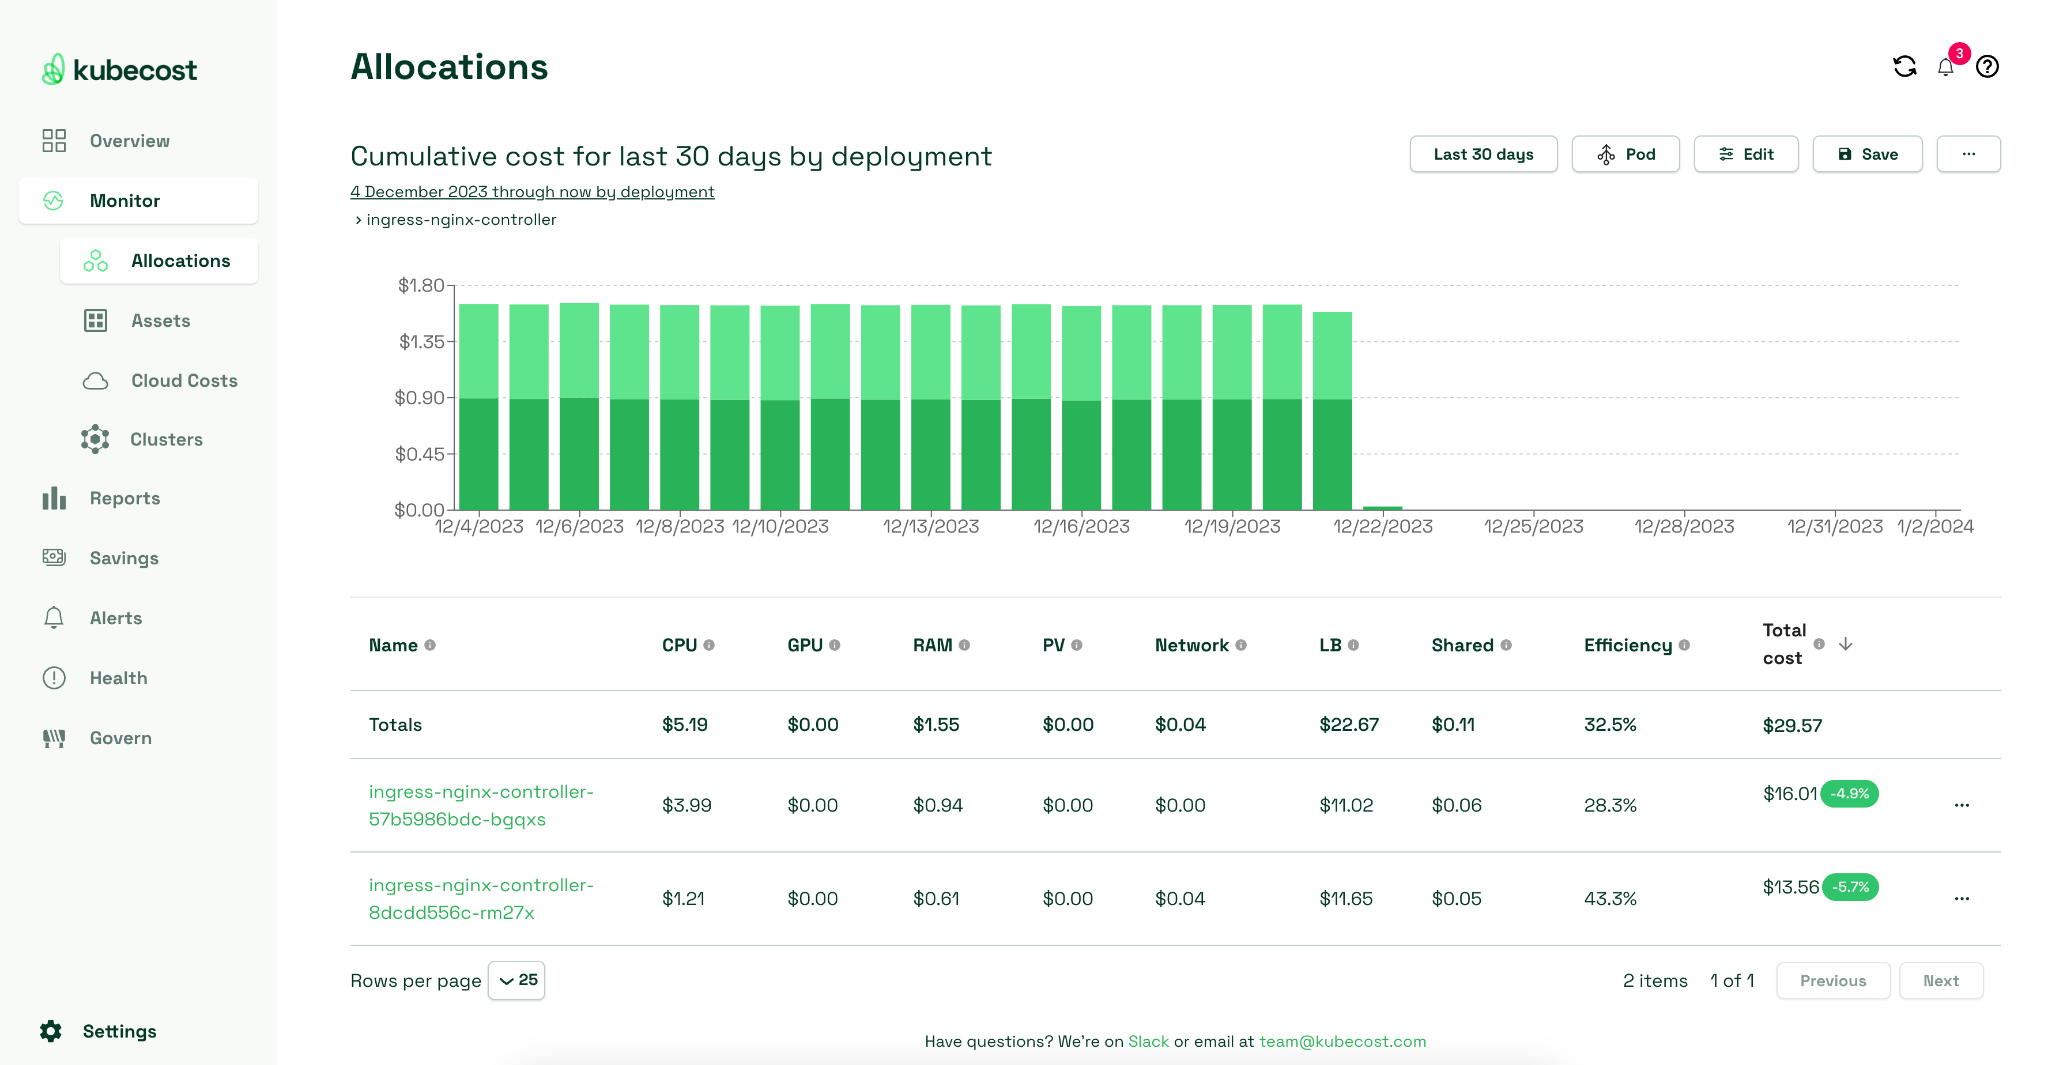
The view below shows a deployment along with its allocated costs by type of resource and its utilization efficiency score (by comparing idle to used resources).
 |
|---|
| Cost attribution and efficiency report for a Kubernetes deployment |
These historical cost measurements can serve as benchmarks for setting initial alerting or budget thresholds.
2. Notifications
Kubecost supports the following types of cost alert notifications:
- Recurring Update: Great for creating scheduled cost reports allocated by namespace.
- Budget: Great for surfacing a budget overrun relative to a defined threshold.
- Spend Change: Great for detecting a jump in your spending habits (based on a historical moving average).
- Efficiency: Great for detecting over-provisioned CPU, memory, or storage according to a defined efficiency ratio threshold between 0 and 1.
Let us expand some more on these alerting use cases. You can visit this page (here) to get a full list of the alert types supported by Kubecost.
Recurring Update Alert
This mode of alerting is better thought of as a scheduled report. Suppose an engineering manager responsible for a Kubernetes cluster has created multiple namespaces to delegate self-administration to various application teams. The engineering manager can schedule a “recurring update” alert to receive a regular report of usage and cost allocated by namespace to ensure that each group uses a fair portion of the shared cluster.
Budget Alert
The budget alert compares daily spending to a preset threshold (that can be typed in the Kubecost user interface) and alerts only if the threshold is exceeded. Once you combine this alert with the cost allocation feature of Kubecost, you achieve the fastest mechanism to notify the right person who is capable of rectifying a cost overrun on the very first day that the excess occurs, thus avoiding an end-of-month surprise.
Spend Change Alert
This type of alert is most helpful if you don’t have a preset budget or would like to avoid setting thresholds altogether. Instead, you would simply like to know if your spending experiences a sudden unexpected increase. By comparing your current spending to a historical trend line, you will receive an alert as soon as your spending breaks from a typical daily pattern.
Efficiency Alert
An increase in spending is not always bad as it may be directly related to increased workload or increased business activity. The efficiency index identifies waste in your Kubernetes cluster, but it also detects bottlenecks. The efficiency alert notifies administrators of over and under-provisioning of resources that often go undetected for long periods.
To set the scope of an alert, simply add criteria to the aggregation (as defined in the aggregated cost model API) and filter settings. Aggregation supports dimensions such as cluster, namespace, controller, deployment, service, label, pod, and container. Filters let you choose which aggregations (such as a specific namespace) to include in the notification.
When you set up alerts based on usage per namespace (or per cluster), you can conveniently define daily budget thresholds in the UI unique to each project or team and direct notifications to relevant parties and collaborative tools. In this way, you not only cut out the noise, but you also deliver valuable information directly to the stakeholders who can act on it.
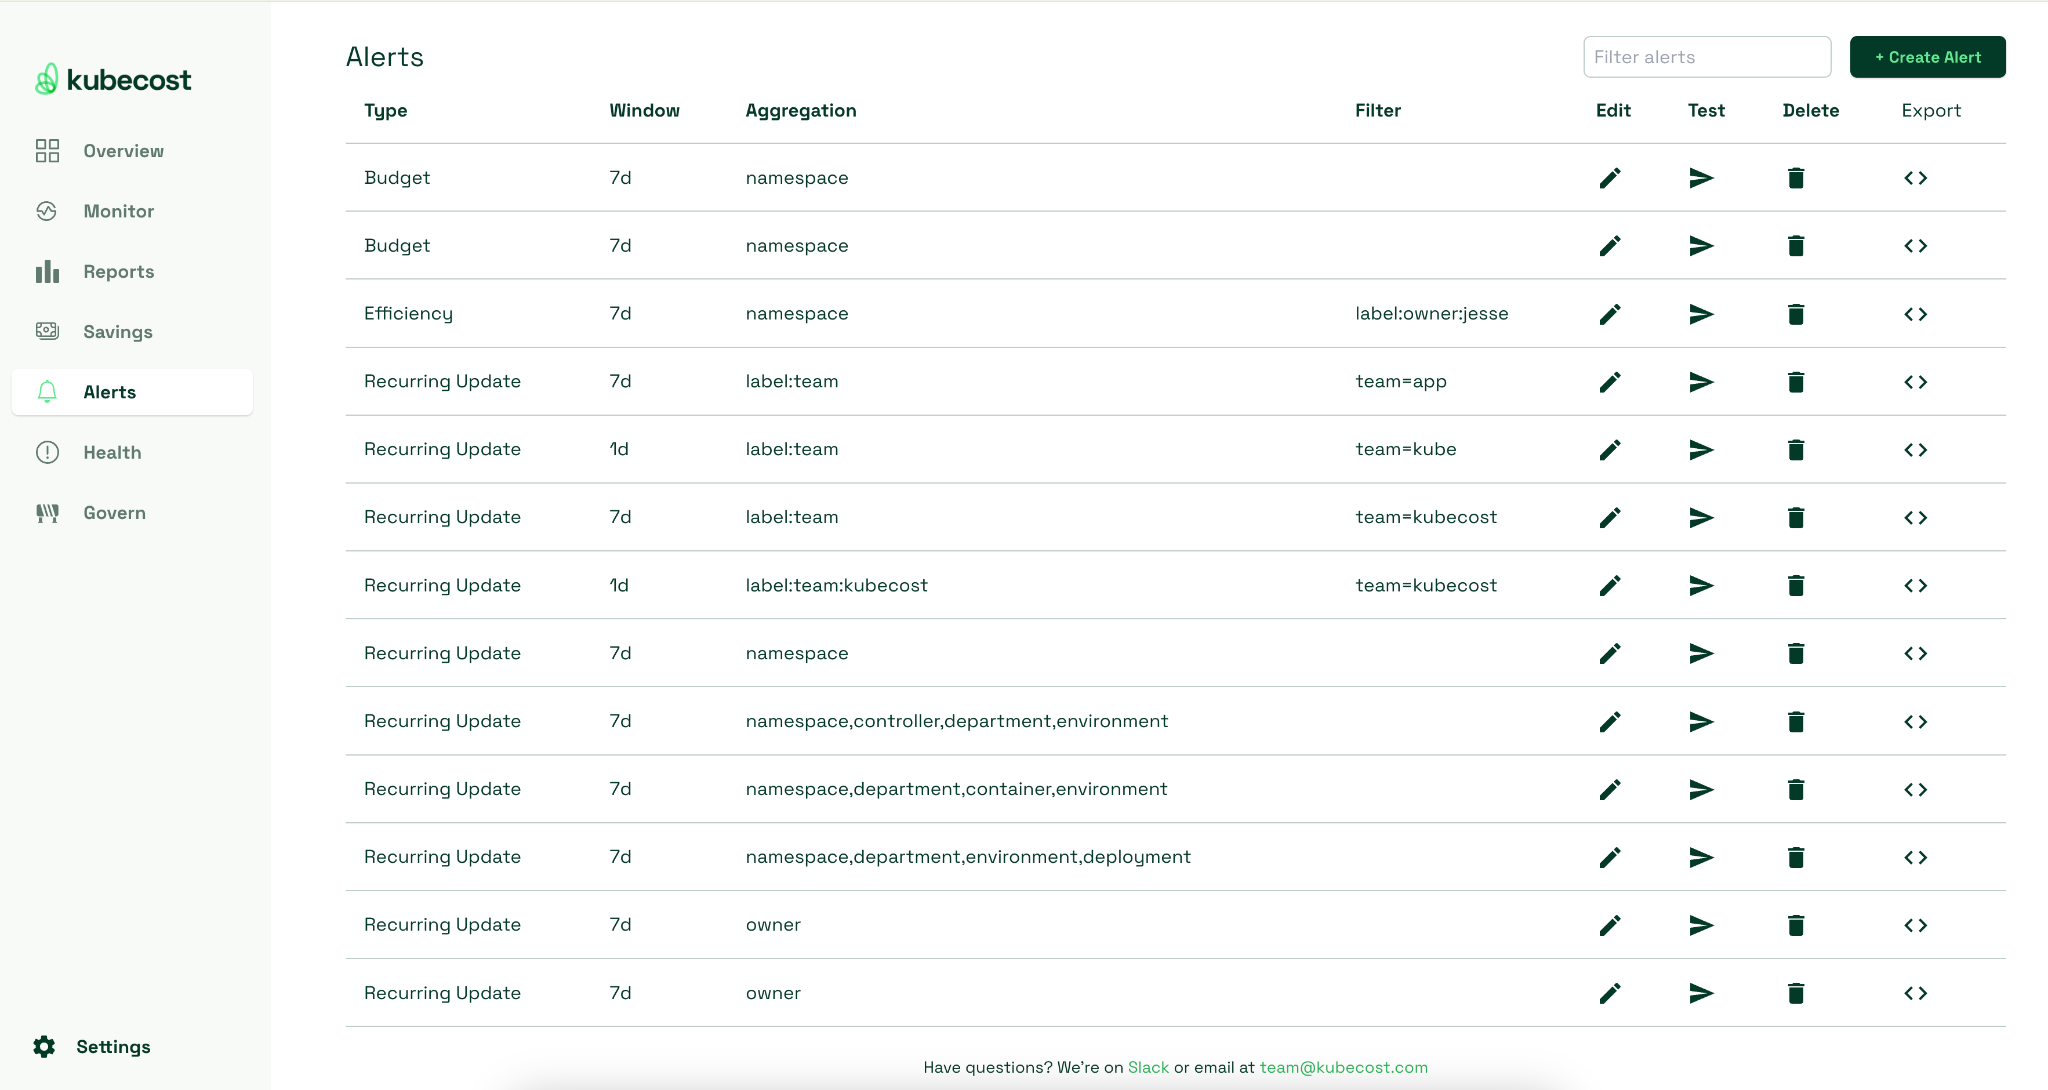
 |
|---|
| The alert page in the Kubecost user interface |
Via Email
 |
|---|
| Kubecost Email Notification |
Via Slack
 |
|---|
| Kubecost Slack Notification |
Via Webhook
A third option is to simply use a generic webhook to integrate with just about any third-party tool such as PagerDuty or OpsGenie.
K8s clusters handling 10B daily API calls use Kubecost
Learn MoreHow to Get Started with Kubecost Alerts
Kubecost is available as a Helm chart or a cloud-hosted service. The cloud-hosted version is available at this link (here), and the instructions for installing the downloadable version are presented below.
1. Install Kubecost
Installing Kubecost in your Kubernetes cluster only takes a few minutes using Helm. Follow the installation guide and can configure all of the alerts in the Helm values section as shown below.
2. Set up Cost Alerts
You can configure your cost alerts from the Kubecost Helm values file. For each alert you complete the following:
- Define your thresholds based on your budgetary goals.
- Filter namespaces unrelated to a given project or team.
- Add notifications for stakeholder awareness.
The following is an example of a Helm values block.
 notifications:
    # Kubecost alerting configuration
    # Ref: http://docs.kubecost.com/alerts
    alertConfigs:
            frontendUrl: http://localhost:9090 # optional, used for linkbacks
      globalSlackWebhookUrl: "https://hooks.slack.com/services/<REDACTED>" # optional, used for Slack alerts

      globalAlertEmails:
        - user1@example.com
      alerts: # Alerts generated by kubecost, about cluster data
          # Daily namespace budget alert on namespace `kubecost`
        - type: budget # supported: budget, recurringUpdate
          threshold: 0.50 # optional, required for budget alerts
          window: daily # or 1d
          aggregation: namespace
          filter: elasticsearch
          ownerContact: # optional, overrides globalAlertEmails default
            - user1@example.com
            - user2@example.com
          slackWebhookUrl: "https://hooks.slack.com/services/T069Z9TFF/<REDACTED>" # optional, used for alert-specific Slack alerts
          # Daily cluster budget alert (clusterCosts alert) on cluster `cluster-one`
        - type: budget
          threshold: 1.0 # optional, required for budget alerts
          window: daily # or 1d
          aggregation: cluster
          filter: prod-cluster # does not accept csv
          # Recurring weekly update (weeklyUpdate alert)
        - type: recurringUpdate
          window: weekly # or 7d
          aggregation: namespace
          filter: '*'
          # Recurring weekly namespace update on kubecost namespace
        - type: recurringUpdate
          window: weekly # or 7d
          aggregation: namespace
          filter: kubecost
          # Spend Change Alert
        - type: spendChange  # change relative to moving avg
          relativeThreshold: 0.20  # Proportional change relative to baseline. Must be greater than -1 (can be negative)
          window: 1d                # accepts 'd', 'h'
          baselineWindow: 30d       # previous window, offset by window
          aggregation: namespace
          filter: kubecost, default # accepts csv
3. Scale Across Clusters
For production deployment, we recommend that you configure the system using the Helm values file (instead of using the UI). This enables you to reference your Helm values file for configuration across multiple clusters; to reuse your Helm values file, simply provide the path of the Helm chart and values file to your continuous delivery (CD) system (such as ArgoCD) and wait for the product to be deployed.
Once deployed, you’ll see the following workloads in your cluster:
 |
|---|
| Kubecost Deployment Example |
4. View
We recommend accessing Kubecost’s UI by exposing it over an ingress. This is similar to how you might give access to other resources, such as a Jenkins UI.
If you would just like to quickly explore the product:
- Run the following command:
kubectl port-forward --namespace kubecost deployment/kubecost-cost-analyzer 9090 - Navigate to http://localhost:9090.
- Explore.
Let Kubecost run for a couple of hours before taking a full tour so that there is enough data in the system to populate all fields.
Learn how to manage K8s costs via the Kubecost APIs
WATCH 30 MIN YOUTUBE VIDEOSetup Tips
- Kubecost integrates with most Identity providers (such as Google Auth) and also supports SAML-based authentication. All of this can be configured in the Helm values file.
- Kubecost uses Prometheus alertmanager for alert delivery. If you already have an instance of alertmanager running, you can configure its endpoint in the Helm values file, and Kubecost can use that for alert notifications.
 notifications:
    # Kubecost alerting configuration
    # Ref: http://docs.kubecost.com/alerts
    alertConfigs:
  ...

    alertmanager: # Supply an alertmanager FQDN to receive notifications from the app.
      enabled: true # If true, allow kubecost to write to your alertmanager
      fqdn: http://kubecost-prometheus-alertmanager #example fqdn. Ignored if prometheus.enabled: true
See the Kubecost troubleshooting guide or join the Kubecost Slack group for community advice and support.

Comprehensive Kubernetes cost monitoring & optimization
Conclusion
Kubecost provides a holistic view of infrastructure cost by collating both in-cluster and out-of-cluster resources with support for all leading public cloud providers. It takes this a step further by generating timely alerts and actionable scheduled reports for your stakeholders, allowing them to better control overspending on cloud resources.
From an operational standpoint, setup is quick and painless. Kubecost integrates with all leading identity providers, and you can also use an existing alert manager or Prometheus installation to integrate with, which is a huge plus, especially when most teams already have a Prometheus deployment running in their clusters.