Deploy Kubecost on a Redhat OpenShift cluster
In this blog post, you will learn how to deploy Kubecost on a Redhat OpenShift cluster with step-by-step instructions.
Overview
Many organizations have already adopted or started exploring containers and Kubernetes to modernize their infrastructures and applications. According to Cloud Native Computing Foundation (CNCF) survey in 2021, 96% of organizations are either using or evaluating Kubernetes. To evaluate the success of a modernization project, you should start with the business first and then focus on technologies later. However, in the CNCF and FinOps Foundation survey, there are 24% of organizations do not monitor their Kubernetes spending, or only rely on monthly estimates (44%). As the modernization journey gathers pace, organizations have been looking for ways to accurately track Kubernetes spending, allocate costs, and chargeback organization units (teams, departments, etc …). They also need a solution that can work in different environments whether it is on-premises or in the cloud environments.
Founded in 2019, Kubecost was launched to provide customers with visibility into spending and resource efficiency in Kubernetes environments, and today helps thousands of teams address this challenge. Kubecost is built on OpenCost, which was recently accepted as a Cloud Native Computing Foundation (CNCF) Sandbox project. Kubecost also supports different Kubernetes platforms running on-premises or on different cloud providers such as the Redhat OpenShift cluster.
Next, let’s start with the Architecture overview and then move forward to the installation section for instructions.
Architecture overview:
Currently, there are 2 main options to deploy Kubecost on Redhat OpenShift Cluster (OCP).
Standard deployment:
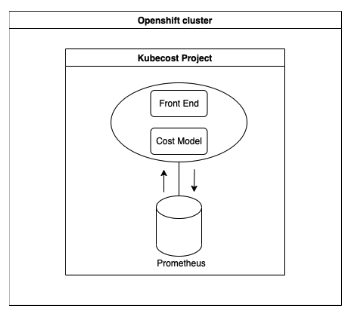
Kubecost is installed with Cost Analyzer and Prometheus as a time-series database. Data is gathered by the Prometheus installed with Kubecost (bundled Prometheus). Other metrics are scraped by bundled Prometheus from OCP monitoring stack managed components like Kube State Metrics (KSM), Openshift Service Mesh (OSM), CAdvisor, etc …. Kubecost then pushes and queries metrics to/from bundled Prometheus. Enterprise setup could also work with Thanos as an additional component.
The standard deployment is illustrated in the following diagram:

Grafana managed Prometheus deployment:
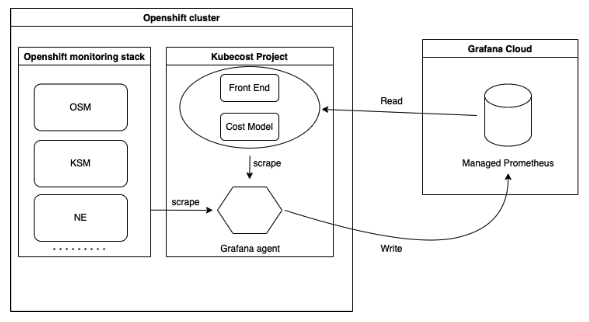
Kubecost is installed with the core components only (cost model, frontend) without bundled Prometheus and other components. Grafana agent is installed as part of the solution to scrape the metrics from OCP monitoring stack managed components and Kubecost /metrics endpoint to write the data back to the Grafana Cloud managed Prometheus (Grafana Prometheus) instance. Kubecost reads the metrics directly from Grafana managed Prometheus.
The Grafana managed Prometheus deployment is illustrated in the following diagram:

Installation instructions:
Standard deployment:
Prerequisites:
- You have an existing OpenShift cluster.
- You have appropriate access to that OpenShift cluster to create a new project and deploy new workloads.
Installation:
Step 1: Clone this repository to your dev environment.
git clone https://github.com/kubecost/openshift-helm-chart.git
cd openshift-helm-chart
Step 2: Update configuration.
Replace $CLUSTER_NAME with your desired value in this file values-openshift.yaml
Step 3: Install Kubecost.
Then install against the local cost-analyzer repo using the following helm install command:
helm upgrade --install kubecost ./cost-analyzer --namespace kubecost --create-namespace -f ./values-openshift.yaml
Wait for all pods to be ready.
Create a route to the service kubecost-cost-analyzer on port 9090 of the kubecost project. You can learn more about how to do it on your OpenShift portal in this LINK
Kubecost will be collecting data, please wait 5-15 minutes before the UI to reflects the resources in the local cluster.
Grafana managed Prometheus deployment:
Prerequisites:
- You have created a Grafana Cloud account and you have permissions to create Grafana Cloud API keys
- Add required service account for grafana-agent to
hostmount-anyuidSCC:
oc adm policy add-scc-to-user hostmount-anyuid system:serviceaccount:kubecost:grafana-agent
Installation:
Step 1: Clone this repository to your dev environment.
git clone https://github.com/kubecost/openshift-helm-chart.git
cd openshift-helm-chart
Step 2: Install the Grafana Agent on your cluster.
On the existing K8s cluster that you intend to install Kubecost, run the following commands to install Grafana agent to scrape the metrics from Kubecost /metrics endpoint. The script below installs Grafana agent with the necessary scraping configuration for Kubecost, you may want to add an additional scrape configuration for your setup. Please remember to replace the following values with your actual Grafana cloud’s values:
- REPLACE-WITH-GRAFANA-PROM-REMOTE-WRITE-ENDPOINT
- REPLACE-WITH-GRAFANA-PROM-REMOTE-WRITE-USERNAME
- REPLACE-WITH-GRAFANA-PROM-REMOTE-WRITE-API-KEY
- REPLACE-WITH-YOUR-CLUSTER-NAME
cat <<'EOF' |

kind: ConfigMap
metadata:
  name: grafana-agent
apiVersion: v1
data:
  agent.yaml: |
    metrics:
      wal_directory: /var/lib/agent/wal
      global:
        scrape_interval: 60s
        external_labels:
          cluster: <REPLACE-WITH-YOUR-CLUSTER-NAME>
      configs:
      - name: integrations
        remote_write:
        - url: https://<REPLACE-WITH-GRAFANA-PROM-REMOTE-WRITE-ENDPOINT>
          basic_auth:
            username: <REPLACE-WITH-GRAFANA-PROM-REMOTE-WRITE-USERNAME>
            password: <REPLACE-WITH-GRAFANA-PROM-REMOTE-WRITE-API-KEY>
        scrape_configs: #Need further scrape config update
        - job_name: kubecost
          honor_labels: true
          scrape_interval: 1m
          scrape_timeout: 10s
          metrics_path: /metrics
          scheme: http
          dns_sd_configs:
          - names:
            - kubecost-cost-analyzer.kubecost
            type: 'A'
            port: 9003
        - job_name: kubecost-networking
          kubernetes_sd_configs:
            - role: pod
          relabel_configs:
          # Scrape only the the targets matching the following metadata
            - source_labels: [__meta_kubernetes_pod_label_app]
              action: keep
              regex:  'kubecost-network-costs'
        - job_name: kubernetes-nodes-cadvisor
          honor_timestamps: true
          scrape_interval: 1m
          scrape_timeout: 10s
          metrics_path: /metrics
          scheme: https
          authorization:
            type: Bearer
            credentials_file: /var/run/secrets/kubernetes.io/serviceaccount/token
          tls_config:
            ca_file: /var/run/secrets/kubernetes.io/serviceaccount/ca.crt
            insecure_skip_verify: true
          follow_redirects: true
          relabel_configs:
          - separator: ;
            regex: __meta_kubernetes_node_label_(.+)
            replacement: $1
            action: labelmap
          - separator: ;
            regex: (.*)
            target_label: __address__
            replacement: kubernetes.default.svc:443
            action: replace
          - source_labels: [__meta_kubernetes_node_name]
            separator: ;
            regex: (.+)
            target_label: __metrics_path__
            replacement: /api/v1/nodes/$1/proxy/metrics/cadvisor
            action: replace
          metric_relabel_configs:
          - source_labels: [__name__]
            separator: ;
            regex: (container_cpu_usage_seconds_total|container_memory_working_set_bytes|container_network_receive_errors_total|container_network_transmit_errors_total|container_network_receive_packets_dropped_total|container_network_transmit_packets_dropped_total|container_memory_usage_bytes|container_cpu_cfs_throttled_periods_total|container_cpu_cfs_periods_total|container_fs_usage_bytes|container_fs_limit_bytes|container_cpu_cfs_periods_total|container_fs_inodes_free|container_fs_inodes_total|container_fs_usage_bytes|container_fs_limit_bytes|container_cpu_cfs_throttled_periods_total|container_cpu_cfs_periods_total|container_network_receive_bytes_total|container_network_transmit_bytes_total|container_fs_inodes_free|container_fs_inodes_total|container_fs_usage_bytes|container_fs_limit_bytes|container_spec_cpu_shares|container_spec_memory_limit_bytes|container_network_receive_bytes_total|container_network_transmit_bytes_total|container_fs_reads_bytes_total|container_network_receive_bytes_total|container_fs_writes_bytes_total|container_fs_reads_bytes_total|cadvisor_version_info)
            replacement: $1
            action: keep
          - source_labels: [container]
            separator: ;
            regex: (.+)
            target_label: container_name
            replacement: $1
            action: replace
          - source_labels: [pod]
            separator: ;
            regex: (.+)
            target_label: pod_name
            replacement: $1
            action: replace
          kubernetes_sd_configs:
          - role: node
            kubeconfig_file: ""
            follow_redirects: true
        - job_name: kubernetes-service-endpoints
          honor_timestamps: true
          scrape_interval: 1m
          scrape_timeout: 10s
          metrics_path: /metrics
          scheme: http
          follow_redirects: true
          relabel_configs:
          - source_labels: [__meta_kubernetes_service_annotation_prometheus_io_scrape]
            separator: ;
            regex: "true"
            replacement: $1
            action: keep
          - source_labels: [__meta_kubernetes_service_annotation_prometheus_io_scheme]
            separator: ;
            regex: (https?)
            target_label: __scheme__
            replacement: $1
            action: replace
          - source_labels: [__meta_kubernetes_service_annotation_prometheus_io_path]
            separator: ;
            regex: (.+)
            target_label: __metrics_path__
            replacement: $1
            action: replace
          - source_labels: [__address__, __meta_kubernetes_service_annotation_prometheus_io_port]
            separator: ;
            regex: ([^:]+)(?::\d+)?;(\d+)
            target_label: __address__
            replacement: $1:$2
            action: replace
          - separator: ;
            regex: __meta_kubernetes_service_label_(.+)
            replacement: $1
            action: labelmap
          - source_labels: [__meta_kubernetes_namespace]
            separator: ;
            regex: (.*)
            target_label: kubernetes_namespace
            replacement: $1
            action: replace
          - source_labels: [__meta_kubernetes_service_name]
            separator: ;
            regex: (.*)
            target_label: kubernetes_name
            replacement: $1
            action: replace
          - source_labels: [__meta_kubernetes_pod_node_name]
            separator: ;
            regex: (.*)
            target_label: kubernetes_node
            replacement: $1
            action: replace
          metric_relabel_configs:
          - source_labels: [__name__]
            separator: ;
            regex: (container_cpu_allocation|container_cpu_usage_seconds_total|container_fs_limit_bytes|container_fs_writes_bytes_total|container_gpu_allocation|container_memory_allocation_bytes|container_memory_usage_bytes|container_memory_working_set_bytes|container_network_receive_bytes_total|container_network_transmit_bytes_total|DCGM_FI_DEV_GPU_UTIL|deployment_match_labels|kube_daemonset_status_desired_number_scheduled|kube_daemonset_status_number_ready|kube_deployment_spec_replicas|kube_deployment_status_replicas|kube_deployment_status_replicas_available|kube_job_status_failed|kube_namespace_annotations|kube_namespace_labels|kube_node_info|kube_node_labels|kube_node_status_allocatable|kube_node_status_allocatable_cpu_cores|kube_node_status_allocatable_memory_bytes|kube_node_status_capacity|kube_node_status_capacity_cpu_cores|kube_node_status_capacity_memory_bytes|kube_node_status_condition|kube_persistentvolume_capacity_bytes|kube_persistentvolume_status_phase|kube_persistentvolumeclaim_info|kube_persistentvolumeclaim_resource_requests_storage_bytes|kube_pod_container_info|kube_pod_container_resource_limits|kube_pod_container_resource_limits_cpu_cores|kube_pod_container_resource_limits_memory_bytes|kube_pod_container_resource_requests|kube_pod_container_resource_requests_cpu_cores|kube_pod_container_resource_requests_memory_bytes|kube_pod_container_status_restarts_total|kube_pod_container_status_running|kube_pod_container_status_terminated_reason|kube_pod_labels|kube_pod_owner|kube_pod_status_phase|kube_replicaset_owner|kube_statefulset_replicas|kube_statefulset_status_replicas|kubecost_cluster_info|kubecost_cluster_management_cost|kubecost_cluster_memory_working_set_bytes|kubecost_network_internet_egress_cost|kubecost_network_region_egress_cost|kubecost_network_zone_egress_cost|kubecost_node_is_spot|kubecost_pod_network_egress_bytes_total|node_cpu_hourly_cost|node_cpu_seconds_total|node_disk_reads_completed|node_disk_reads_completed_total|node_disk_writes_completed|node_disk_writes_completed_total|node_filesystem_device_error|node_gpu_count|node_gpu_hourly_cost|node_memory_Buffers_bytes|node_memory_Cached_bytes|node_memory_MemAvailable_bytes|node_memory_MemFree_bytes|node_memory_MemTotal_bytes|node_network_transmit_bytes_total|node_ram_hourly_cost|node_total_hourly_cost|pod_pvc_allocation|pv_hourly_cost|service_selector_labels|statefulSet_match_labels|up)
            replacement: $1
            action: keep
          kubernetes_sd_configs:
          - role: endpoints
            kubeconfig_file: ""
            follow_redirects: true
        - job_name: kubernetes-service-endpoints-slow
          honor_timestamps: true
          scrape_interval: 5m
          scrape_timeout: 30s
          metrics_path: /metrics
          scheme: http
          follow_redirects: true
          relabel_configs:
          - source_labels: [__meta_kubernetes_service_annotation_prometheus_io_scrape_slow]
            separator: ;
            regex: "true"
            replacement: $1
            action: keep
          - source_labels: [__meta_kubernetes_service_annotation_prometheus_io_scheme]
            separator: ;
            regex: (https?)
            target_label: __scheme__
            replacement: $1
            action: replace
          - source_labels: [__meta_kubernetes_service_annotation_prometheus_io_path]
            separator: ;
            regex: (.+)
            target_label: __metrics_path__
            replacement: $1
            action: replace
          - source_labels: [__address__, __meta_kubernetes_service_annotation_prometheus_io_port]
            separator: ;
            regex: ([^:]+)(?::\d+)?;(\d+)
            target_label: __address__
            replacement: $1:$2
            action: replace
          - separator: ;
            regex: __meta_kubernetes_service_label_(.+)
            replacement: $1
            action: labelmap
          - source_labels: [__meta_kubernetes_namespace]
            separator: ;
            regex: (.*)
            target_label: kubernetes_namespace
            replacement: $1
            action: replace
          - source_labels: [__meta_kubernetes_service_name]
            separator: ;
            regex: (.*)
            target_label: kubernetes_name
            replacement: $1
            action: replace
          - source_labels: [__meta_kubernetes_pod_node_name]
            separator: ;
            regex: (.*)
            target_label: kubernetes_node
            replacement: $1
            action: replace
          kubernetes_sd_configs:
          - role: endpoints
            kubeconfig_file: ""
            follow_redirects: true
        - job_name: prometheus-pushgateway
          honor_labels: true
          honor_timestamps: true
          scrape_interval: 1m
          scrape_timeout: 10s
          metrics_path: /metrics
          scheme: http
          follow_redirects: true
          relabel_configs:
          - source_labels: [__meta_kubernetes_service_annotation_prometheus_io_probe]
            separator: ;
            regex: pushgateway
            replacement: $1
            action: keep
          kubernetes_sd_configs:
          - role: service
            kubeconfig_file: ""
            follow_redirects: true
        - job_name: kubernetes-services
          honor_timestamps: true
          params:
            module:
            - http_2xx
          scrape_interval: 1m
          scrape_timeout: 10s
          metrics_path: /probe
          scheme: http
          follow_redirects: true
          relabel_configs:
          - source_labels: [__meta_kubernetes_service_annotation_prometheus_io_probe]
            separator: ;
            regex: "true"
            replacement: $1
            action: keep
          - source_labels: [__address__]
            separator: ;
            regex: (.*)
            target_label: __param_target
            replacement: $1
            action: replace
          - separator: ;
            regex: (.*)
            target_label: __address__
            replacement: blackbox
            action: replace
          - source_labels: [__param_target]
            separator: ;
            regex: (.*)
            target_label: instance
            replacement: $1
            action: replace
          - separator: ;
            regex: __meta_kubernetes_service_label_(.+)
            replacement: $1
            action: labelmap
          - source_labels: [__meta_kubernetes_namespace]
            separator: ;
            regex: (.*)
            target_label: kubernetes_namespace
            replacement: $1
            action: replace
          - source_labels: [__meta_kubernetes_service_name]
            separator: ;
            regex: (.*)
            target_label: kubernetes_name
            replacement: $1
            action: replace
          kubernetes_sd_configs:
          - role: service
            kubeconfig_file: ""
            follow_redirects: true
        - job_name: integrations/kubernetes/kubelet
          bearer_token_file: /var/run/secrets/kubernetes.io/serviceaccount/token
          kubernetes_sd_configs:
            - role: node
          relabel_configs:
            - replacement: kubernetes.default.svc:443
              target_label: __address__
            - regex: (.+)
              replacement: /api/v1/nodes/$1/proxy/metrics
              source_labels:
                - __meta_kubernetes_node_name
              target_label: __metrics_path__
          scheme: https
          tls_config:
              ca_file: /var/run/secrets/kubernetes.io/serviceaccount/ca.crt
              insecure_skip_verify: false
              server_name: kubernetes

EOF
(export NAMESPACE=kubecost && kubectl apply -n $NAMESPACE -f -)


MANIFEST_URL=https://raw.githubusercontent.com/kubecost/openshift-helm-chart/main/grafana-agent-config/agent-bare.yaml NAMESPACE=kubecost /bin/sh -c "$(curl -fsSL https://raw.githubusercontent.com/grafana/agent/v0.24.2/production/kubernetes/install-bare.sh)" | kubectl apply -f -
To learn more about how to install and config Grafana agent as well as additional scrape configuration, please refer to Grafana Agent for Kubernetes section of the Grafana Cloud documentation. Or you can check Kubecost Prometheus scrape config at this Github repository.
Step 3: Verify if grafana-agent is scraping data successfully.
kubectl -n kubecost logs grafana-agent-0
Step 4: Create dbsecret to allow Kubecost to query the metrics from Grafana Cloud Prometheus.
- Create two files in your working directory, called
USERNAMEandPASSWORDrespectively
export PASSWORD=<REPLACE-WITH-GRAFANA-PROM-REMOTE-WRITE-API-KEY>
export USERNAME=<REPLACE-WITH-GRAFANA-PROM-REMOTE-WRITE-USERNAME>
printf "${PASSWORD}" > PASSWORD
printf "${USERNAME}" > USERNAME
- Verify that you can run query against your Grafana Cloud Prometheus query endpoint with your API key (Optional):
cred="$( echo $NAME:$PASSWORD | base64 )"; curl -H "Authorization: Basic $cred" https://<REPLACE-WITH-GRAFANA-PROM-QUERY-ENDPOINT>/api/v1/query?query=up
- Create K8s secret name dbsecret:
kubectl create secret generic dbsecret \
    --namespace kubecost \
    --from-file=USERNAME \
    --from-file=PASSWORD
- Verify if the credentials appears correctly - Optional (Any trailing space or new line etc …)
kubectl -n kubecost get secret dbsecret -o json | jq '.data | map_values(@base64d)'
Step 5 (optional): Configure Kubecost recording rules for Grafana Cloud using cortextool.
To set up recording rules in Grafana Cloud, download the cortextool CLI utility. While they are optional, they offer improved performance.
After installing the tool, create a file called kubecost-rules.yaml with the following command:
cat << EOF > kubecost-rules.yaml
namespace: "kubecost"
groups:
  - name: CPU
    rules:
      - expr: sum(rate(container_cpu_usage_seconds_total{container_name!=""}[5m]))
        record: cluster:cpu_usage:rate5m
      - expr: rate(container_cpu_usage_seconds_total{container_name!=""}[5m])
        record: cluster:cpu_usage_nosum:rate5m
      - expr: avg(irate(container_cpu_usage_seconds_total{container_name!="POD", container_name!=""}[5m])) by (container_name,pod_name,namespace)
        record: kubecost_container_cpu_usage_irate
      - expr: sum(container_memory_working_set_bytes{container_name!="POD",container_name!=""}) by (container_name,pod_name,namespace)
        record: kubecost_container_memory_working_set_bytes
      - expr: sum(container_memory_working_set_bytes{container_name!="POD",container_name!=""})
        record: kubecost_cluster_memory_working_set_bytes
  - name: Savings
    rules:
      - expr: sum(avg(kube_pod_owner{owner_kind!="DaemonSet"}) by (pod) * sum(container_cpu_allocation) by (pod))
        record: kubecost_savings_cpu_allocation
        labels:
          daemonset: "false"
      - expr: sum(avg(kube_pod_owner{owner_kind="DaemonSet"}) by (pod) * sum(container_cpu_allocation) by (pod)) / sum(kube_node_info)
        record: kubecost_savings_cpu_allocation
        labels:
          daemonset: "true"
      - expr: sum(avg(kube_pod_owner{owner_kind!="DaemonSet"}) by (pod) * sum(container_memory_allocation_bytes) by (pod))
        record: kubecost_savings_memory_allocation_bytes
        labels:
          daemonset: "false"
      - expr: sum(avg(kube_pod_owner{owner_kind="DaemonSet"}) by (pod) * sum(container_memory_allocation_bytes) by (pod)) / sum(kube_node_info)
        record: kubecost_savings_memory_allocation_bytes
        labels:
          daemonset: "true"
EOF
Then, make sure you are in the same directory as your kubecost-rules.yaml, load the rules using cortextool. Replace the address with your Grafana Cloud’s Prometheus endpoint (Remember to omit the /api/prom path from the endpoint URL).
cortextool rules load \
--address=<REPLACE-WITH-GRAFANA-PROM-ENDPOINT> \
--id=<REPLACE-WITH-GRAFANA-PROM-REMOTE-WRITE-USERNAME> \
--key=<REPLACE-WITH-GRAFANA-PROM-REMOTE-WRITE-API-KEY> \
kubecost-rules.yaml
Print out the rules to verify that they’ve been loaded correctly:
cortextool rules print \
--address=<REPLACE-WITH-GRAFANA-PROM-ENDPOINT> \
--id=<REPLACE-WITH-GRAFANA-PROM-REMOTE-WRITE-USERNAME> \
--key=<REPLACE-WITH-GRAFANA-PROM-REMOTE-WRITE-API-KEY>
Step 6: Install Kubecost on the cluster.
Install Kubecost on your K8s cluster with Grafana Cloud Prometheus query endpoint and dbsecret you created in Step 4
helm upgrade -i -n kubecost kubecost ./cost-analyzer \
    --set kubecostModel.promClusterIDLabel=cluster \
    --set global.prometheus.fqdn=https://<REPLACE-WITH-GRAFANA-PROM-QUERY-ENDPOINT> \
    --set global.prometheus.enabled=false \
    --set global.prometheus.queryServiceBasicAuthSecretName=dbsecret
The process is complete. By now, you should have successfully completed the Kubecost integration with Grafana Cloud.
Optionally, you can also add our Kubecost Dashboard for Grafana Cloud to your organization to visualize your cloud costs in Grafana.
Clean up
You can uninstall Kubecost from your cluster with the following command.
helm uninstall kubecost --namespace kubecost
Conclusion
You have learned how to deploy Kubecost on the Redhat OpenShift cluster with different architectures to start tracking and monitoring your Kubernetes spending. As always you can provide feedback on our github repository or if you have any questions, you can contact us on Slack or email at team@kubecost.com
To participate in our free Enterprise onboarding program, contact us at support@kubecost.com to schedule these sessions!