Leverage Grafana Cloud with Kubecost
We’ve rolled out a Kubecost integration for teams using Grafana Cloud!

Kubecost users can take advantage of the integration to get the best of all worlds—managed observability services, working in concert with cloud cost optimization.
What is Grafana Cloud?
Grafana Cloud is a composable observability platform, integrating metrics, traces, and logs with Grafana. Users get the benefit of the best open source observability software, without the overhead of installing, maintaining, and scaling their observability stack.
As a part of its monitoring services, Grafana Cloud offers a managed backend that can store Prometheus metrics. This hosted service allows you to aggregate and store metrics from multiple Prometheus instances into a single, dedicated space. This centralized location makes it easier to query your data, while also providing long term storage for historical analysis and capacity planning.
Kubecost + Grafana Cloud = 💯
If you wish to reduce the overhead of managing and maintaining your observability stack and keep better track of your cloud spend — Grafana Cloud and Kubecost are here to help!
Kubecost automatically provides cost visibility, savings and optimization recommendations, and ongoing governance for deployments in any Kubernetes environment. Teams can successfully reduce the operational burden of managing multiple cost views and manually tracking spend for each of their services. With the help of Kubecost, teams are even able to track and allocate granular spend on their own.
Customers can now use Kubecost to track cloud spend leveraging their Grafana Cloud stack by using a Custom Prometheus integration. To compliment the integration, we’ve published a Kubecost Grafana Cloud Community Dashboard so that customers can visualize their cost data directly in their hosted Grafana.
Get Started
In this section, we’ll walk through a quick example of how you can use Kubecost and Grafana Cloud in sync. You’ll need a running Kubernetes cluster and a Grafana Cloud account.
Step 0: Install the Grafana Agent in your cluster
Using your Grafana Cloud account credentials, install the Grafana Agent for Kubernetes on your cluster as a prerequisite for the following steps.
Step 1: Configure Kubecost scraping configuration for the Grafana Agent
Once you’ve set up the Grafana Agent, we’ll need to add some extra configuration to the way Grafana Cloud scrapes metrics, so that Kubecost can offer more accurate cost estimates.
Create a file called extra_scrape_configs.yaml with the following contents, replacing the grafana_prometheus_remoteWrite_url, username and password placeholders to match your Grafana Cloud details, which you’ll find by visiting your organization’s Grafana Cloud Portal -> Prometheus -> Password/API key:
kind: ConfigMap
metadata:
  name: grafana-agent
apiVersion: v1
data:
  agent.yaml: |
    server:
      http_listen_port: 12345
    metrics:
      wal_directory: /tmp/grafana-agent-wal
      global:
        scrape_interval: 60s
        external_labels:
          cluster: cloud
      configs:
      - name: integrations
        remote_write:
        - url: <grafana_prometheus_remoteWrite_url>
          basic_auth:
            username: # Grafana Cloud username
            password: # Grafana Cloud API key password
        scrape_configs:
        - bearer_token_file: /var/run/secrets/kubernetes.io/serviceaccount/token
          job_name: integrations/kubernetes/cadvisor
          kubernetes_sd_configs:
              - role: node
          metric_relabel_configs:
              - source_labels: [__name__]
Next, apply the changes in the same namespace as your Grafana Agent deployment:
$ kubectl apply extra_scrape_configs.yaml -n <namespace>
Re-start the Grafana Agent:
$ kubectl rollout restart deployment/grafana-agent -n <namespace>
Step 2: Configure Kubecost to query metrics from Grafana Cloud Prometheus
If you haven’t yet installed Kubecost, use the commands below, or check out our installation guide to get set up. Our standard helm install only takes ~2 minutes:
$ helm repo add kubecost https://kubecost.github.io/cost-analyzer/
$ helm upgrade -i --create-namespace kubecost kubecost/cost-analyzer --namespace kubecost
If you already have a Kubecost deployment on your cluster, hooray! Now, we’ll set up some basic auth credentials so that Kubecost can query data from Grafana Cloud.
Grab your Grafana Cloud username and API key from Step 1, and create two files in your working directory, called USERNAME and PASSWORD respectively. Then, generate a Kubernetes secret called dbsecret in the same namespace as Kubecost is installed. The namespace is typically kubecost.
$ kubectl create secret generic dbsecret \
    --namespace kubecost \
    --from-file=USERNAME \
    --from-file=PASSWORD
Reload Kubecost, using the secret you’ve just created, and the Prometheus query URL that you can get from your organization’s Grafana Cloud Console -> Prometheus -> Query Endpoint:
$ helm upgrade kubecost kubecost/cost-analyzer \
    --namespace kubecost \
    --set global.prometheus.fqdn=<grafana_prometheus_query_url> \
    --set global.prometheus.enabled=false \
    --set global.prometheus.queryServiceBasicAuthSecretName=dbsecret
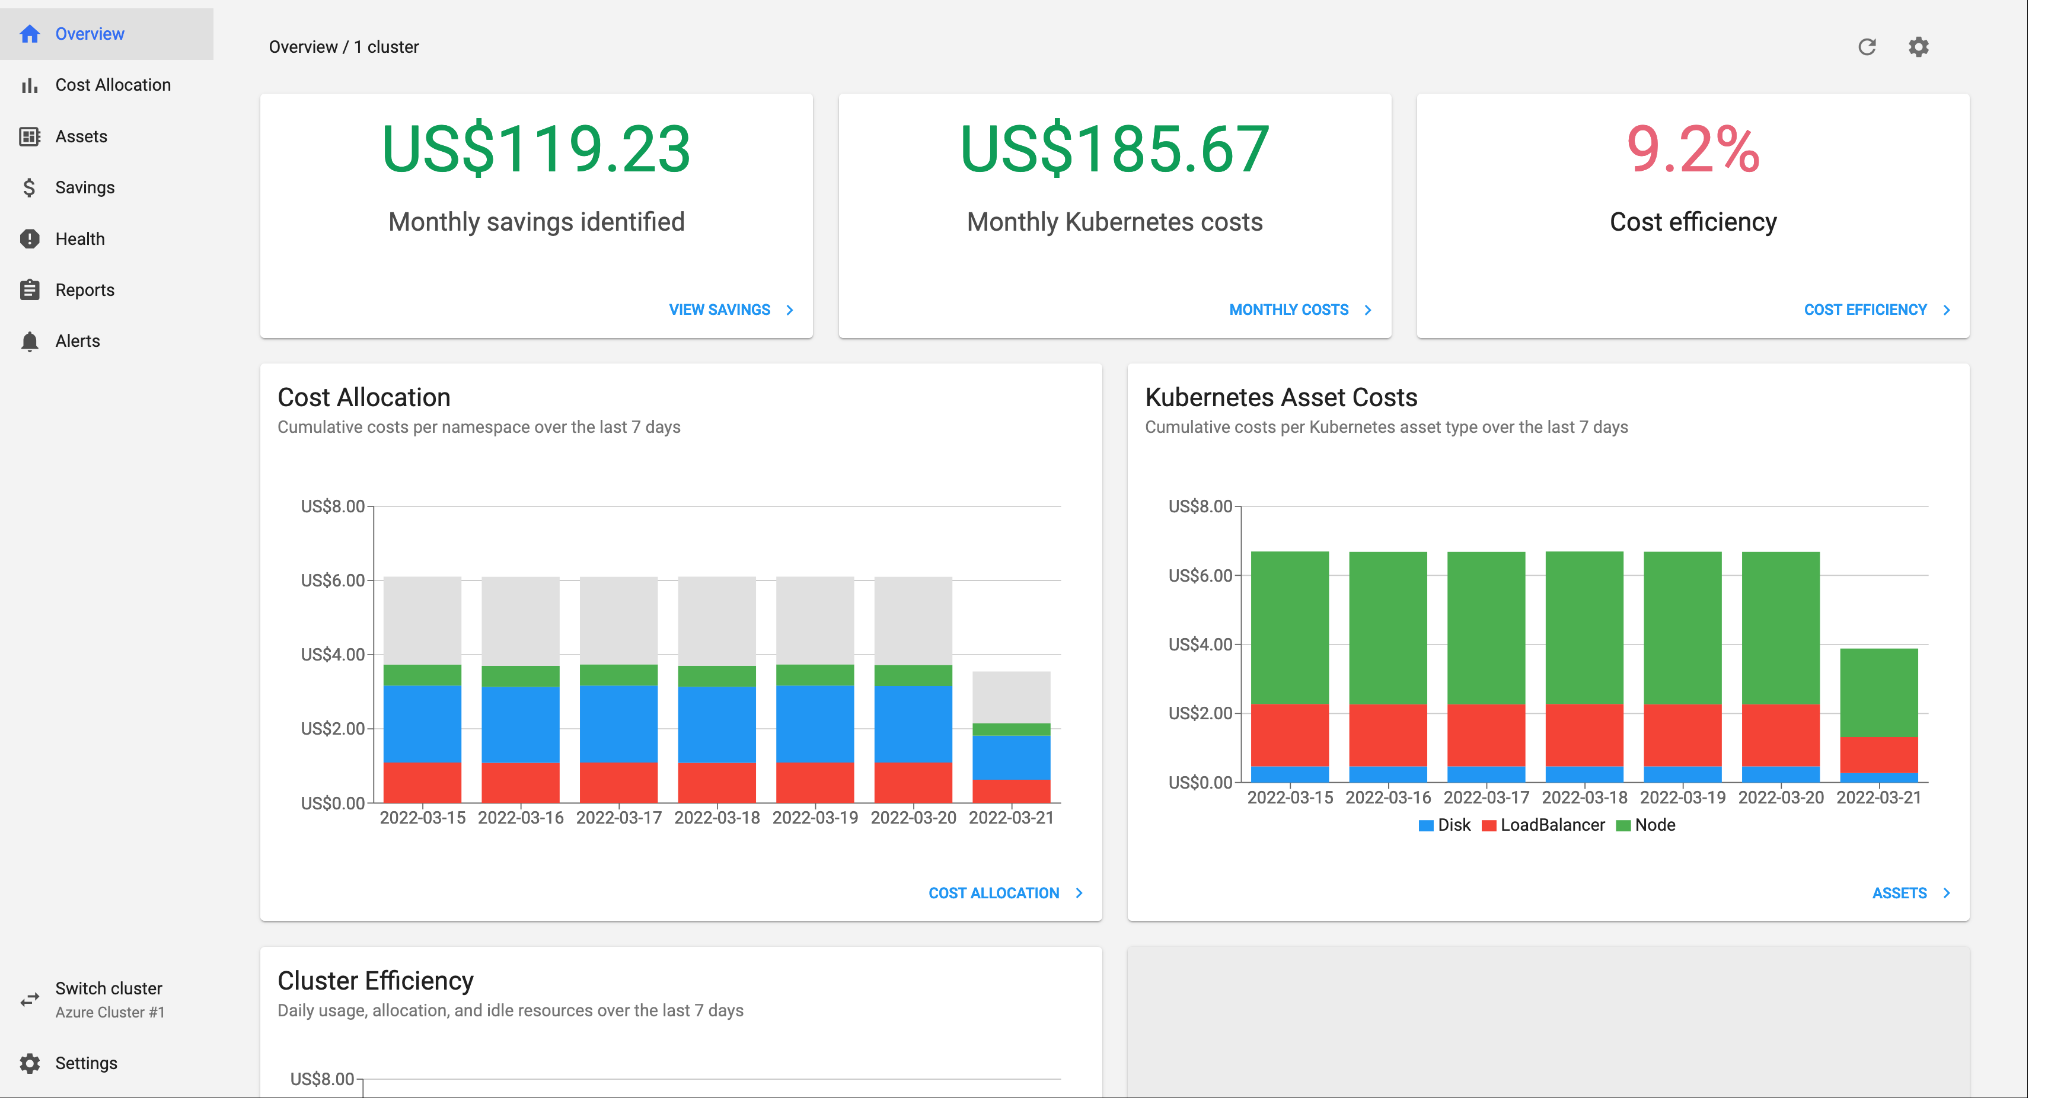
That’s it! By now, you should have successfully completed the Kubecost integration with Grafana Cloud. You can view the Kubecost UI in your browser by port-forwarding to http://localhost:9090/ on your machine:
$ kubectl port-forward --namespace kubecost deployment/kubecost-cost-analyzer 9090
From there, you can start by exploring cost allocation trends by clicking the Allocation tab, or by discovering quick savings and cost optimization insights via the Savings tab.
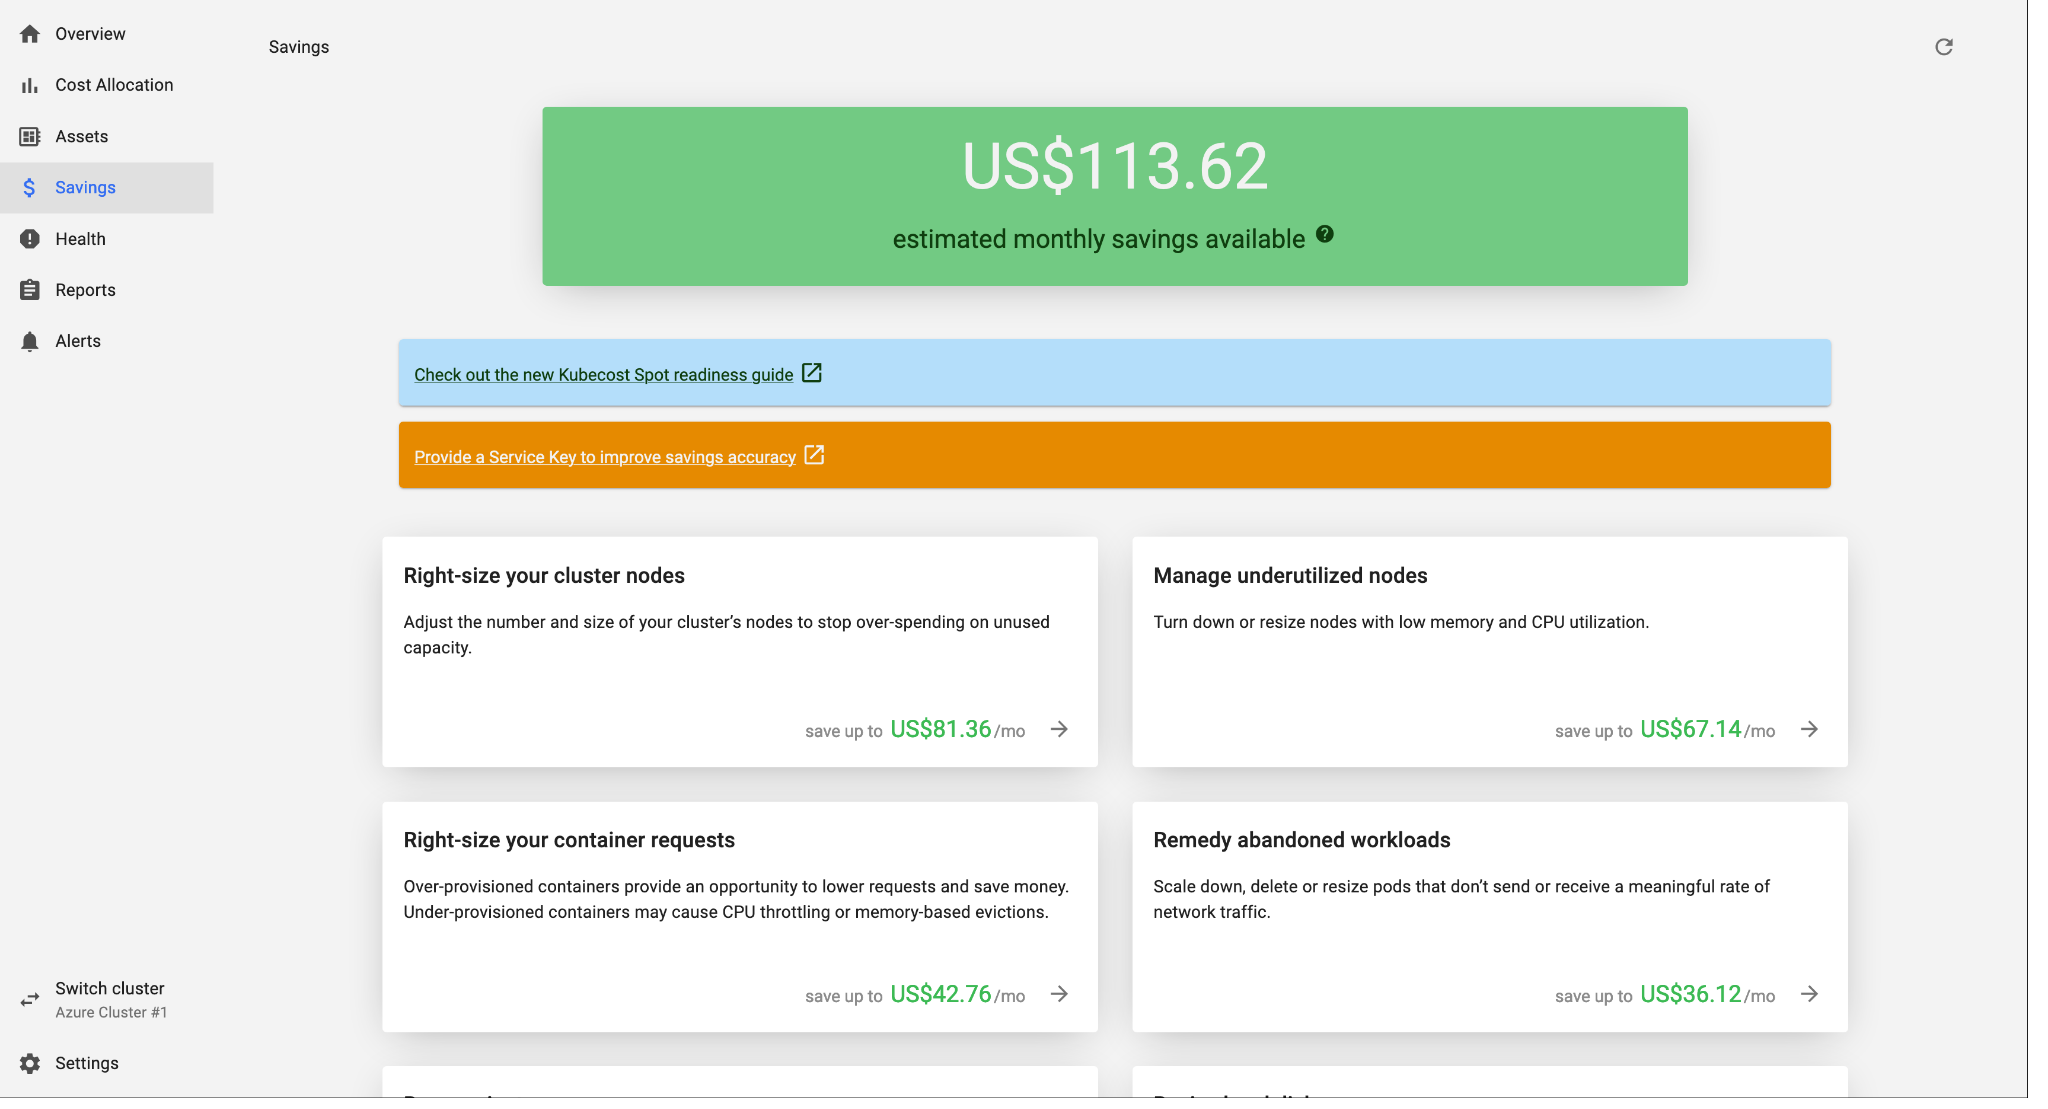
We’ve compiled a list of Getting Started guides to help you take advantage of all of the Kubecost features.
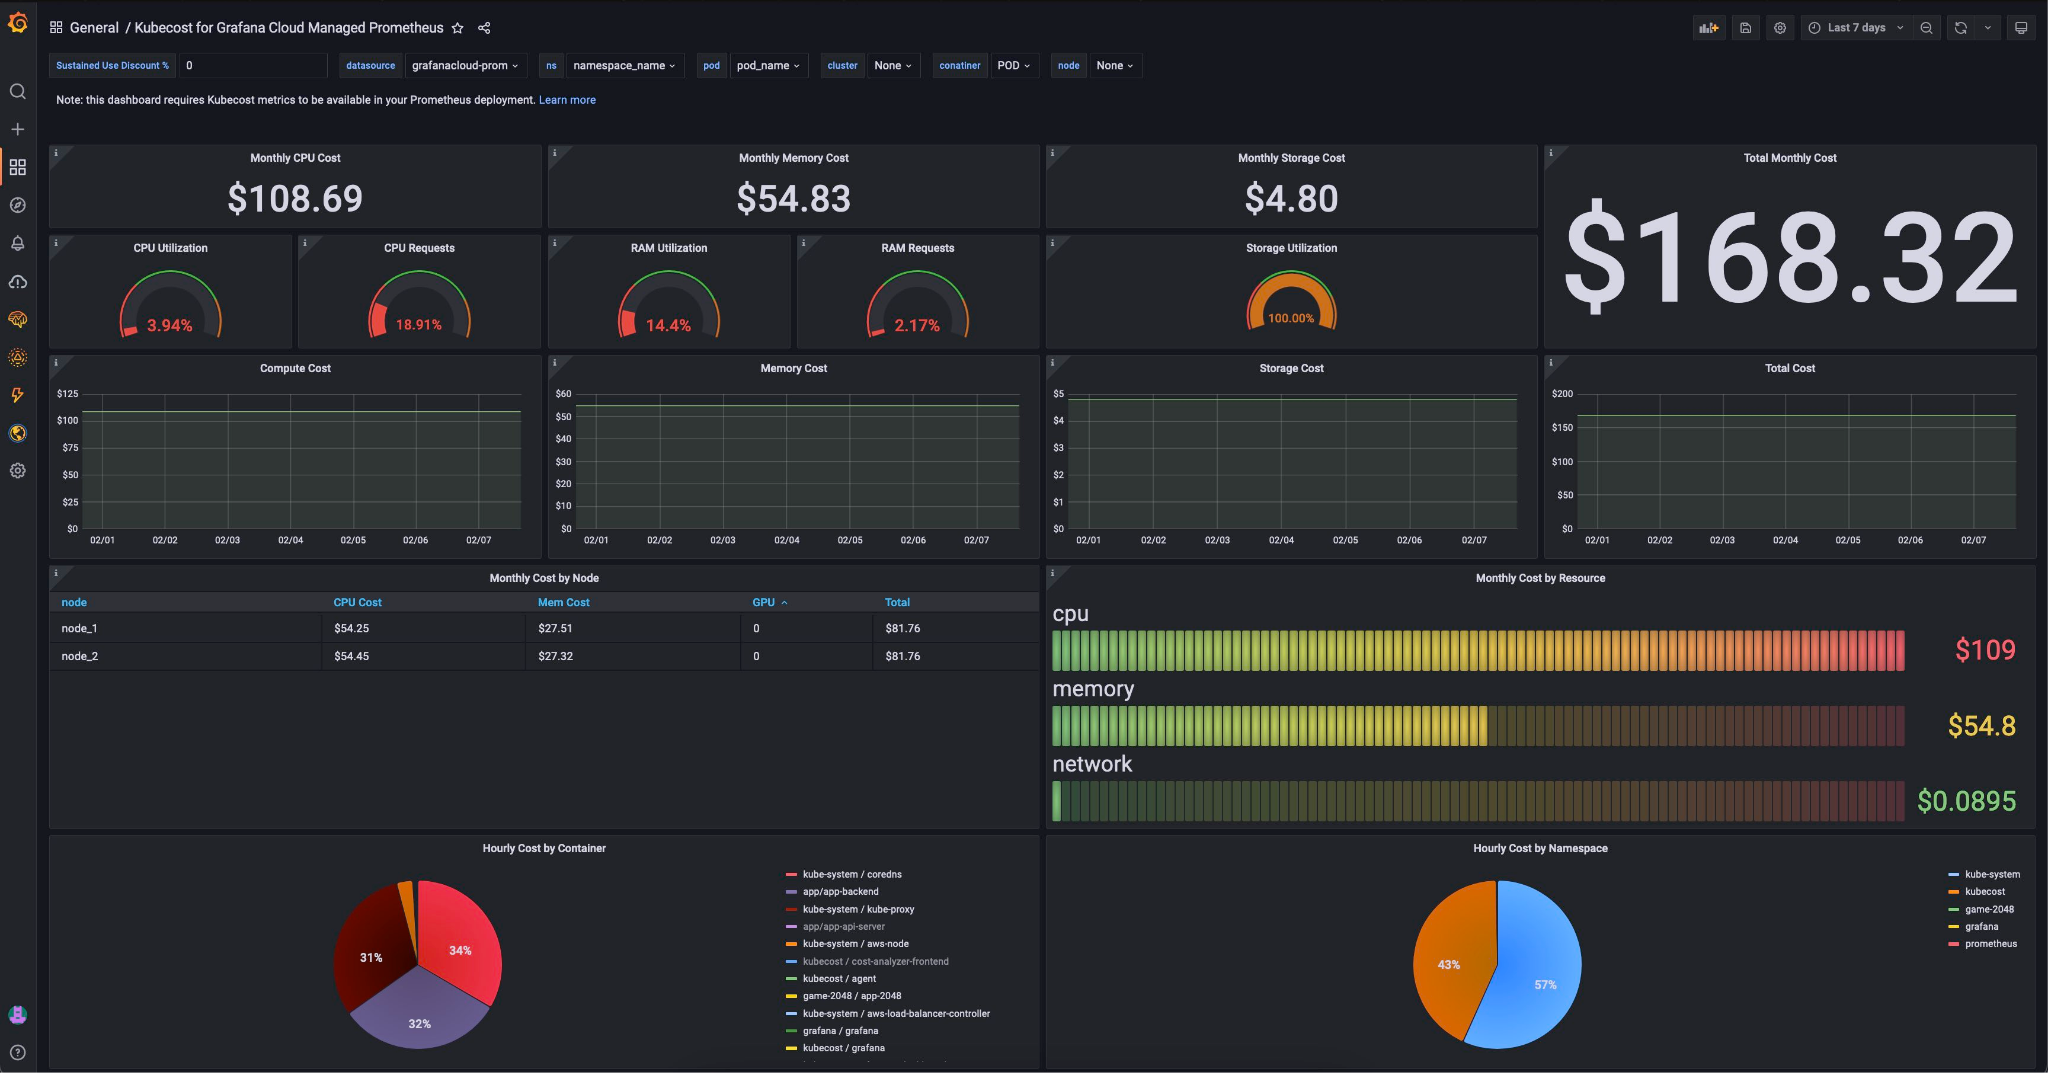
Optionally, you can also add our Kubecost Community Dashboard to your Grafana Cloud organization to visualize your cloud costs in Grafana.
Step 3 (optional): Configure Kubecost recording rules in Grafana Cloud
For even richer Kubecost data, consider adding Prometheus recording rules to Grafana Cloud. While they are optional, they may improve cost accuracy.
We’re here to help!
For more information and troubleshooting, check out the Kubecost documentation and Grafana Cloud documentation.
Join us on Slack for any other help, and general Kubernetes and Cloud Cost optimization banter!