Visualize your Kubernetes Network Costs

For many, Kubernetes networking costs can be a black box leading to unnecessary money spent on networking. Now, with Kubecost you can easily visualize what is incurring network costs across your infrastructure!
Once you have multiple Kubernetes workloads or clusters, it can be really difficult to untangle network spend to understand what resources or workloads are driving it without a tool like Kubecost. If you’ve ever experienced a spike in your networking costs, you know how long and challenging it can be to diagnose and then resolve this anomalous spend—all the while you are continuing to waste money with higher-than-required network costs.
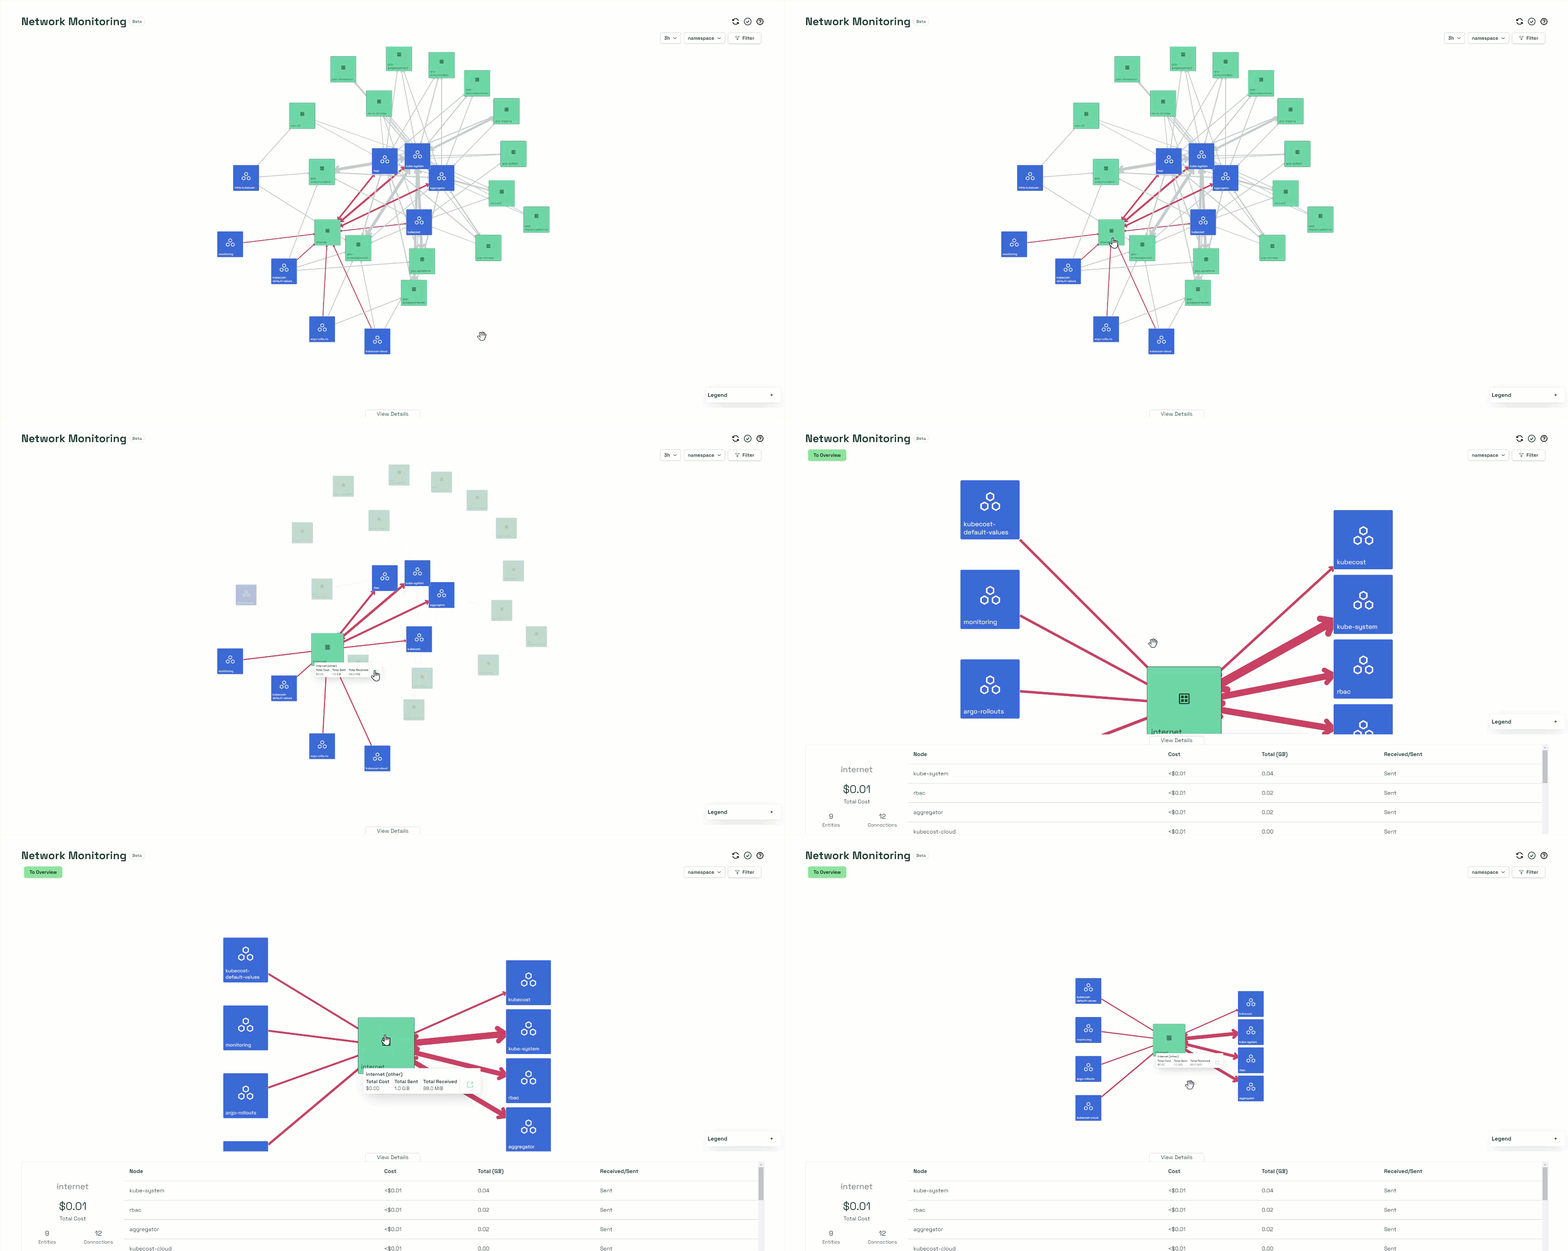
Kubecost 2.0’s new Network Cost Monitoring provides teams with a topology view into your networking spend across Kubernetes environments, workloads, and cloud services. This allows you to easily determine if your networking costs are unnecessarily high due to something like cross availability zone (AZ) pod traffic. The network monitoring graph gives you the ability to instantly see what is driving your networking spend and allows you to drill in on the resources so you can uncover any issues.

Getting started with Network Monitoring
Network Monitoring is available for free to all versions of Kubecost; installing Kubecost is easy, and it can be set up in minutes. Network Monitoring is powered via Kubecost’s network costs daemonSet which uses source and destination details to determine egress and ingress data transfers by pod. The network costs daemonSet can be enabled through the following Helm install command, where cloud provider service configs are set to ‘true’ to enable labeling traffic metrics:
$ helm install kubecost cost-analyzer \
    --repo https://kubecost.github.io/cost-analyzer/ \
    --namespace kubecost --create-namespace \
    --set networkCosts.enabled=true
    --set networkCosts.config.services.amazon-web-services=True
    --set networkCosts.config.services.google-cloud-services=True
    --set networkCosts.config.services.azure-cloud-services=True
You can then find Network Monitoring in the left navigation of the Kubecost UI by selecting Monitor > Network.
If you are using our free Amazon EKS Optimized tier, you can leverage Kubecost’s new Network Monitoring across all of your clusters at any scale.
How to use Network Monitoring
Network Monitoring provides an interactive map that visualizes the relationships between your Kubernetes resources (namespaces, pods, and clusters) in blue, and your external services (e.g. S3, EC2, internet, etc.) in green. Selecting a graph node will display total costs, including ingress and egress costs. Additionally, you can drill down into individual graph nodes to inspect the costs connected to that entity.
Network Monitoring displays the cross-zone, cross-region, and internet network traffic across all monitored clusters and environments in your infrastructure, assuming they have incurred any network costs. Kubecost supports on-premise clusters as well as clusters from the major cloud providers (AWS, GCP, and Azure).
Network Monitoring also allows you to select a range of time windows, aggregate, and filter cost data so that you can customize your view to examine network costs for specific business contexts (i.e. teams, applications, etc.).
For example, if you want to see all the network costs associated with the Kubecost product, you can set your filter to: Pod contains ‘Kubecost’. This will update the page to only show network traffic associated with pods whose name contains ‘Kubecost’. You can then aggregate by namespace to see which external services Kubecost pods send or receive traffic from.
To learn about all the major functionality of Network Monitoring, you can watch our demo, or delve into our documentation on the feature.
Additionally, you can check out Network Costs Configuration doc for advanced configuration help, including labeling traffic metrics from your cloud provider service endpoints, scraping metrics from a custom Prometheus instance, or setting the log level.
What’s next
We’re just getting started on Network Monitoring! Below are some things we have planned, but we’d love your input on other enhancements you’d like to see!
- Additional aggregation and filter options
- Deep integration with our new anomaly detection experience
- Inline optimization insights based on managing spend
- Robust API Support
Send your suggestions, questions, or feedback to team-kubecost@ibm.com, or join our Slack community!
