Measuring Argo Workflow Costs with Kubecost
Argo is the super popular open source tool for Kubernetes to run workflows, manage clusters, and do much more. One of its most common use cases is orchestrating parallel jobs on Kubernetes. With Kubecost, you can measure the costs of these jobs in real-time, view resource efficiency, and get suggestions for optimizing.
A great convenience of running workloads with Kubernetes is that many teams can share compute resources. Everyone can run their workloads on centrally-managed clusters, which means less overhead for those involved, and more efficient use of compute capacity. However, this resource-sharing can make it difficult to identify how much each team is spending, and whether they are spending efficiently.
Common questions in this vein include:
-
How much of last quarter’s spend was driven by our ML model training pipeline?
-
Do we have workflows requesting more resources than they actually require?
-
How should we budget for future resource use, based on current growth?
Without recording historical data on request and usage data for Kubernetes containers, these questions are impossible to answer accurately. As workflow volumes increase, the answers to these questions become more pressing as small inefficiencies can have a large cumulative impact.
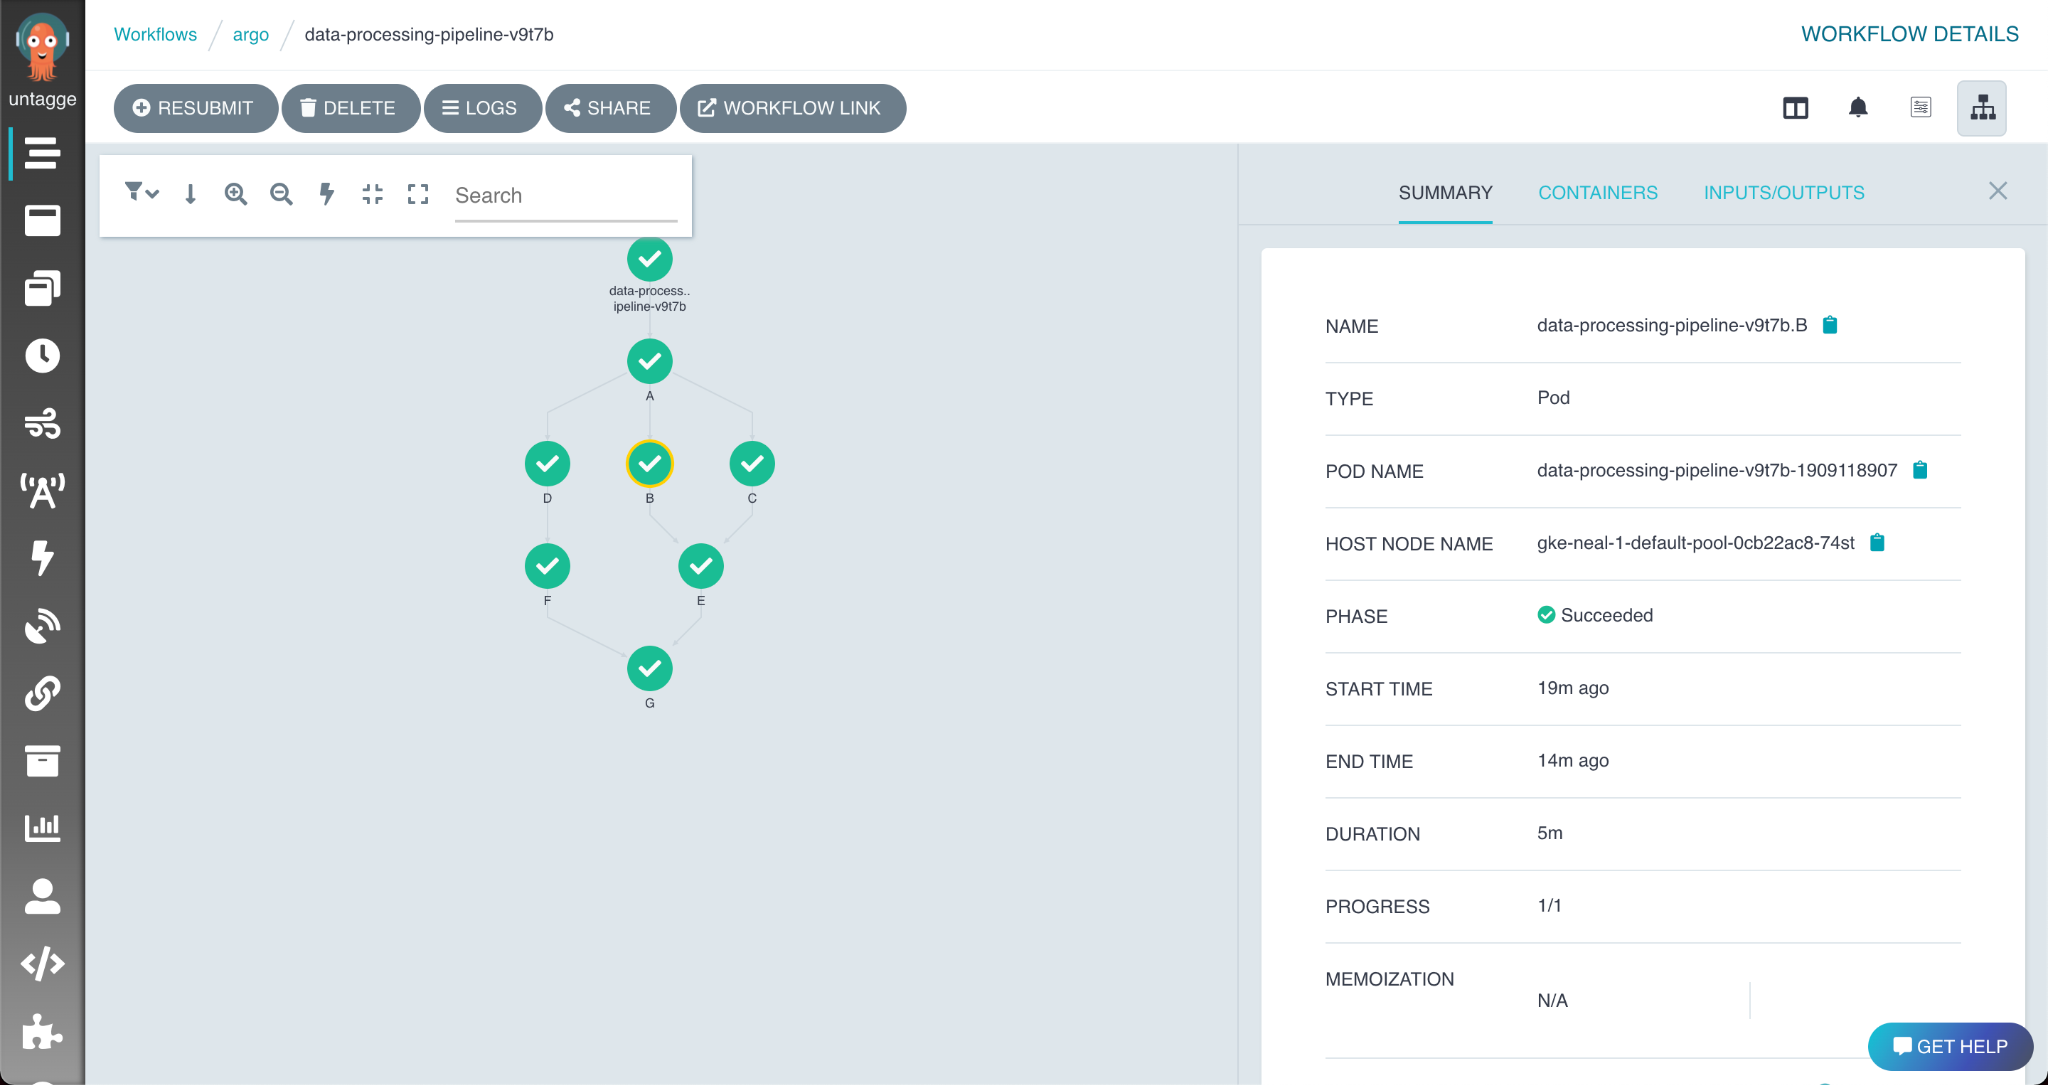
The workflow completed, but what did it cost?
Lucky for us, Kubecost can answer these allocation and efficiency questions, making it a great companion for Argo.
Kubecost
Kubecost is the Kubernetes cost monitoring tool built on open source. The community version is free, and can be installed in minutes.
This guide assumes that you are already using Argo Workflows to manage Kubernetes workloads, and want to analyze workflow costs with Kubecost. If you aren’t using Argo Workflows, it’s easy to get started.
The latest release of Kubecost can be installed via Helm. We recommend installing Kubecost in its own namespace:
helm repo add kubecost https://kubecost.github.io/cost-analyzer/

helm install kubecost kubecost/cost-analyzer --namespace kubecost --create-namesace --set kubecostToken="YXJnby13b3JrZmxvd3MtcG9zdC0xQGt1YmVjb3N0LmNvbQ"
After installation, continue running Argo Workflows as normal. Kubecost will begin collecting cost data as the workflows run.
Creating a workflow
For this post, we’ll create a WorkflowTemplate CRD, defining an Argo Workflow. Under the hood, we’ll be using the stress-ng Docker container to create pods that consume resources, emulating some resource-intensive task.
This workflow has only a single stage: stress. It runs the stress-ng image with inputs that can be given to Argo when the workflow is launched.
apiVersion: argoproj.io/v1alpha1
kind: WorkflowTemplate
metadata:
  name: stress-ng
spec:
  templates:
    - name: stress
      inputs:
        parameters:
          - name: cpu
            value: ''
          - name: vm
            value: ''
          - name: bytes
            value: ''
          - name: timeout
            value: ''
      container:
        name: stress-main
        image: 'docker.io/polinux/stress-ng:latest'
        command:
          - stress-ng
        args:
          - '--cpu'
          - ''
          - '--vm'
          - ''
          - '--vm-bytes'
          - ''
          - '--timeout'
          - ''
         resources:
           requests:
             cpu: 1200m
             memory: 40M
  entrypoint: stress
  arguments:
    parameters:
      - name: cpu
        value: '1'
      - name: vm
        value: '1'
      - name: bytes
        value: 30M
      - name: timeout
        value: '3000'
Note that while the workflow’s CPU request is 1200m and memory request is 40M, the stress-ng container is configured to utilize 1 CPU and 30M of memory while it runs. This leaves the container over-provisioned on memory, and CPU. The result is that the container will claim more resources on our cluster than it needs to run, which is an inefficient use of the cluster’s compute resources.
This yaml represents a WorkflowTemplate CRD. To create them in the argo namespace, save the content to a file and run argo template create $filename -n argo
Measuring cost via the Kubecost UI
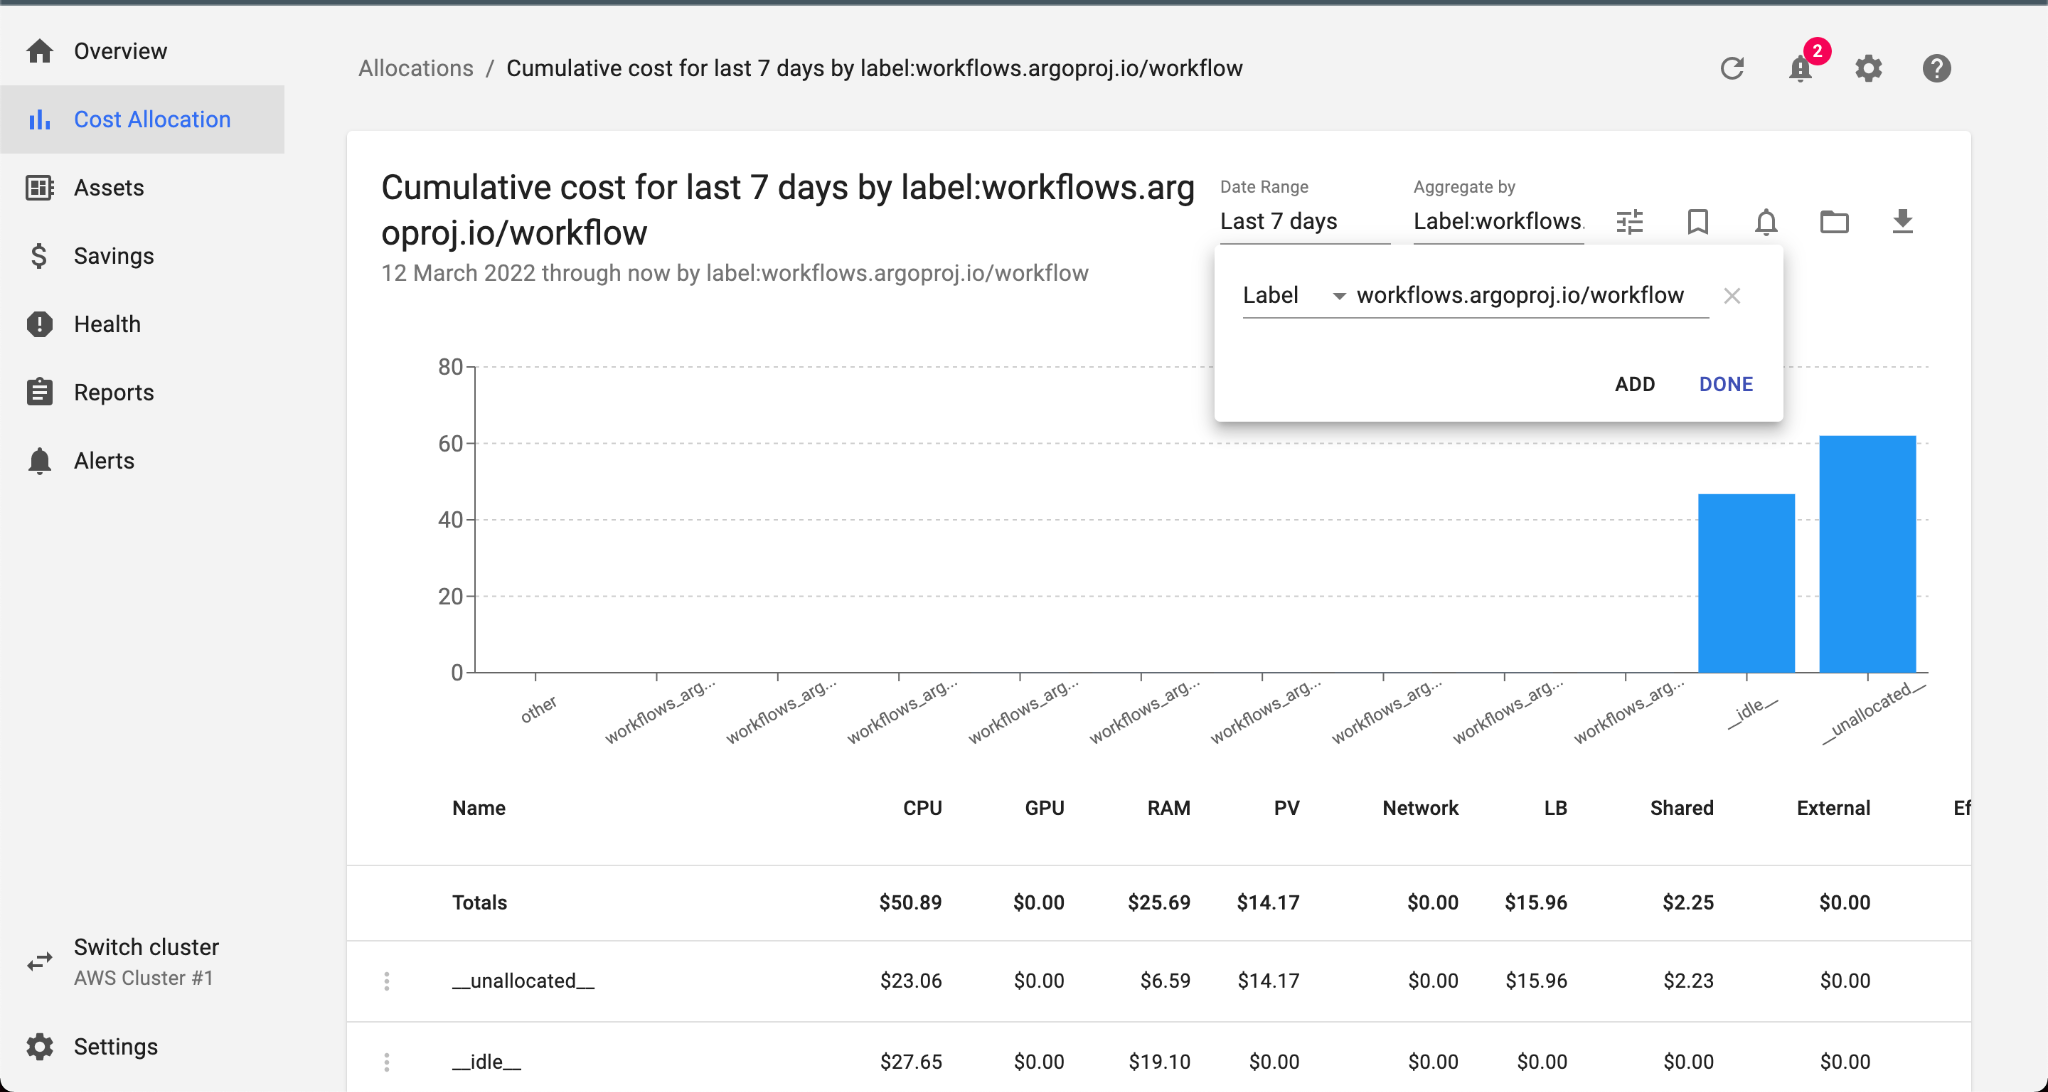
All Argo Workflow jobs have a metadata label: workflows.argoproj.io/workflow. We can use this label to see costs and efficiency organized by workflow. Navigate to the Cost Allocation page, and set the Aggregate By field to “Label: workflows_argoproj_io_workflow”. From here, we can see detailed cost and efficiency breakdowns per-workflow.
Each workflow run is named using the name of the template, plus a short identifier. The first run of the stress-ng workflow was named stress-ng-q9wdz. We can apply a filter to show this workflow specifically, and see that the total cost efficiency of the run Workflow was only 57%! Clicking the name of the workflow opens the Details view for that workflow, which can tell us by how much CPU and RAM, respectively were overprovisioned:
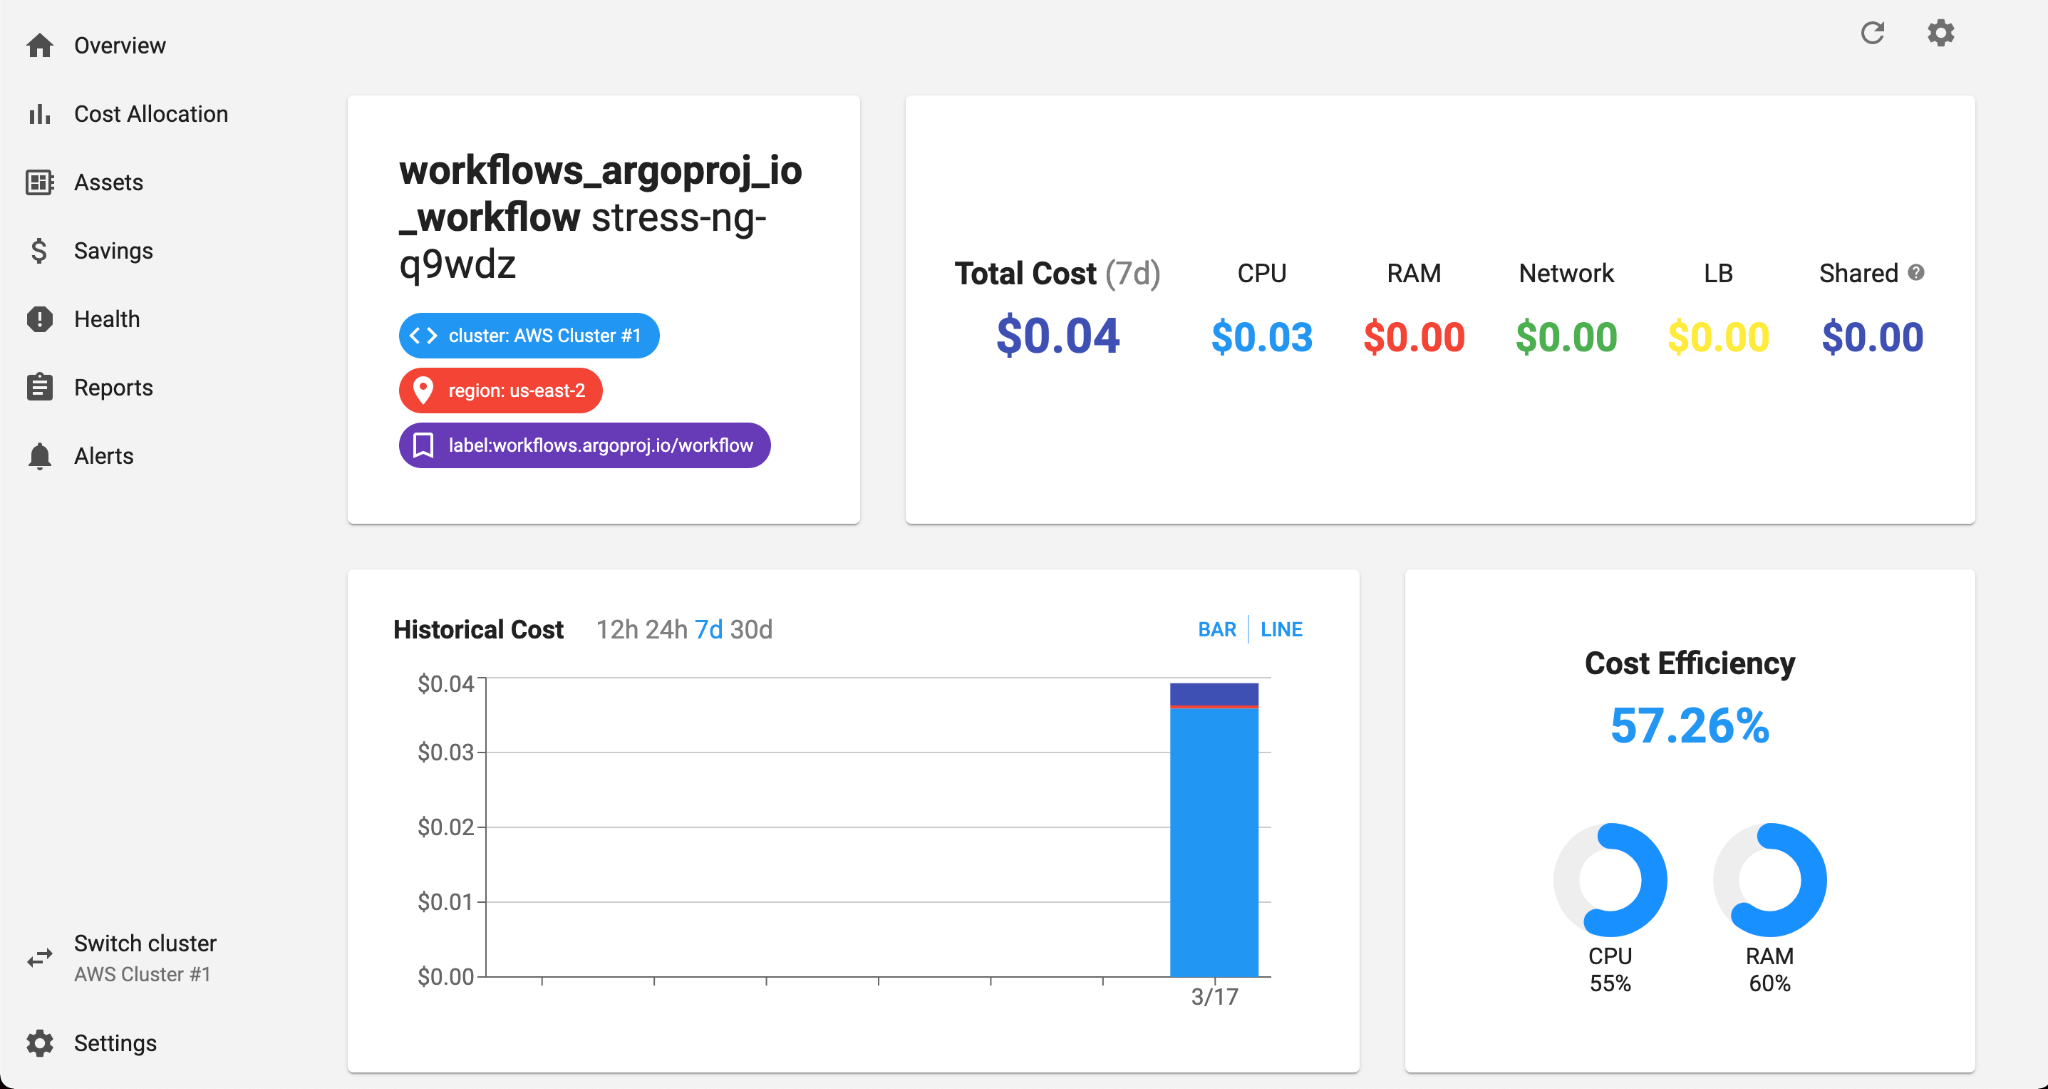
55% of the requested CPU was used, while 60% of the requested RAM was used.
Inspecting cost via the kubectl-cost CLI
Apart from the UI, clusters with Kubecost installed can be inspected via the kubectl-cost CLI tool. Install kubectl-cost with Krew:
kubectl krew install cost
We can then inspect the costs of our workflows with kubectl cost label --label workflows.argoproj.io/workflow:
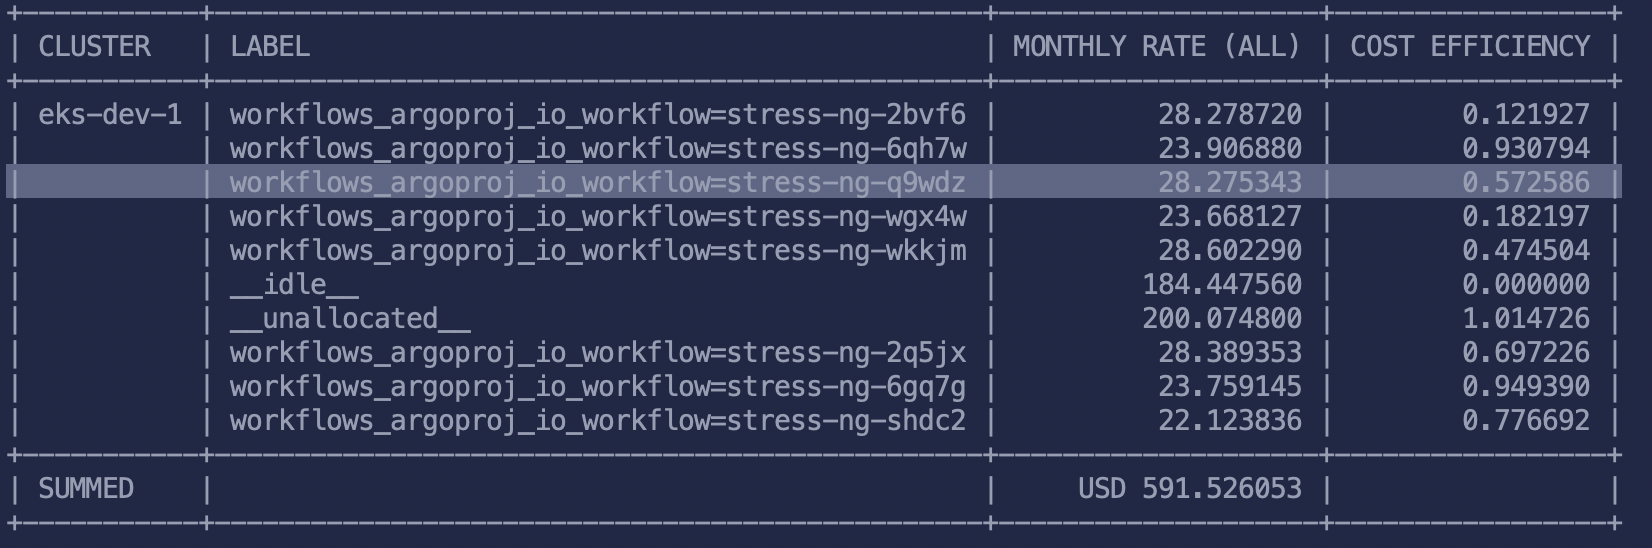
High-precision cost analysis
By default, Kubecost uses publicly listed prices from major cloud providers. To use historical cost data from your actual bill, including custom discounts, reserved instances, and other pricing, you can integrate billing data from GCP, AWS, or Azure. Custom pricing for on-prem deployments can be supplied as well. Detailed instructions can be found here.
Next Steps
Try it out, and let us know what you think! Our supportive community is here for any questions in Slack and email.