Kubernetes Requests and Limits: A Practical Guide and Solutions

Setting Kubernetes requests and limits effectively has a major impact on application performance, stability, and cost. And yet working with many teams has shown us that determining the right values for these parameters is hard. For this reason, we have created this short guide to help teams more accurately set Kubernetes requests and limits for their applications.
The Basics
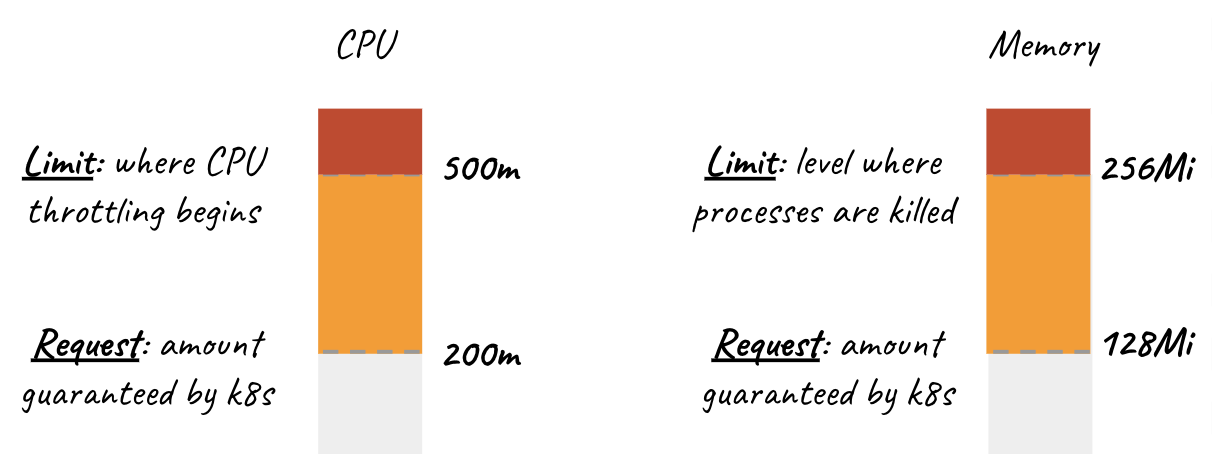
Resource requests and limits are optional parameters specified at the container level. Kubernetes computes a Pod’s request and limit as the sum of requests and limits across all of its containers. Kubernetes then uses these parameters for scheduling and resource allocation decisions.

Requests
Pods will get the amount of memory they request. If they exceed their memory request, they could be killed if another pod happens to need this memory. Pods are only ever killed when using less memory than requested if critical system or high priority workloads need the memory utilization.
Similarly, each container in a Pod is allocated the amount of CPU it requests, if available. It may be allocated additional CPU cycles if available resources are not needed by other running Pods/Jobs.
Note: if a Pod’s total requests are not available on a single node, then the Pod will remain in a Pending state (i.e. not running) until these resources become available.
Limits
Kubernetes resource limits help the Kubernetes scheduler better handle resource contention. When a Pod uses more memory than its Kubernetes CPU memory limit, its processes will be killed by the kernel to protect other applications in the Kubernetes cluster. Pods will be CPU throttled when they exceed their available CPU limit. If no limit is set, then the pods can use excess memory and spare CPU resources when available.
Here’s a quick example of how you set requests and limits on a container spec:
apiVersion: v1
kind: Pod
metadata:
  name: hello-app
spec:
  containers:
  - name: wp
    image: wordpress
    resources:
      requests:
        memory: "64Mi"
        cpu: "250m"
      limits:
        memory: "128Mi"
        cpu: "500m"
CPU requests are set in cpu units where 1000 millicpu (“m”) = 1 vCPU or 1 Core. So 250m CPU = ¼ of a CPU. Memory can be set with Ti, Gi, Mi, or Ki units. For more advanced technical info on the mechanics of these parameters, we suggest this article.
The Tradeoffs
Determining the right level for requests and limits is about managing trade-offs, as shown in the following tables.
Requests
When setting requests, there is inherently a tradeoff between the cost of running an application and the performance/outage risk for this application. Balancing these risks depends on the relative cost of extra CPU/RAM compared to the expected cost of an application throttle or outage event. For example, if allocating another 1 Gb of RAM ($5 cost) reduces the risk of an application outage event ($10,000 cost) by 1% then it would be worth the additional cost of these compute resources.
| Request | Too low | Too high |
|---|---|---|
| CPU | Starvation – may not get CPU cycles needed | Inefficiency – requires extra CPUs to schedule other Pods |
| Memory | Kill risk – may be terminated if other pods need memory | Inefficiency – requires extra RAM to schedule other Pods |
Limits
When setting Kubernetes resource limits, the tradeoffs are similar but not quite the same. The tradeoff here is the relative performance of individual applications on your shared infrastructure vs the total cost of running these applications. For example, setting the aggregated amount of CPU limits higher than the allocated number of CPUs exposes applications to potential throttling risk. Provisioning additional CPUs (i.e. increase spend) is one potential best practice while reducing Kubernetes CPU limits for certain applications (i.e. increase throttling risk) is another.
| Limit | Too low | Too high |
|---|---|---|
| CPU | CPU throttling | Starve other Pods or resource inefficiency |
| Memory | Killed by kernel | Starve other Pods or resource inefficiency |
In the following section, we present a framework for managing these tradeoffs more effectively.
Determining the right values
When setting requests, start by determining the acceptable probability of a container’s usage exceeding its request in a specific time window, e.g. 24 hours. To predict this in future periods, we can analyze historical resource usage. As an example, allowing usage to be above a request threshold with 0.01 probability (i.e. three nines) means that it will, on average, face increased risk of throttling or being killed 1.44 minutes a day.
A Potential Approach
You can classify applications into different availability tiers and apply these rules of thumb for targeting the appropriate level of availability:
| Tier | Request | Limit |
|---|---|---|
| Critical / Highly Available | 99.99th percentile + 100% headroom | 2x request or as higher if resources available |
| Production / Non-critical | 99th + 50% headroom | 2x request |
| Dev / Experimental | 95th or consider namespace quotas* | 1.5x request or consider namespace quotas* |
This best practice of analyzing historical usage patterns typically provides both a good representation of the future and is easy to understand/introspect. Applying extra headroom allows for fluctuations that may have been missed by your historical sampling. We recommend measuring usage over 1 week at a minimum and setting thresholds based on the specific availability requirements of your pod.
*Developers sharing experimental clusters may rely on broader protection from resource quotas. Quotas set aggregate caps at the namespace level and can help protect tasks like long-running batch or ML jobs from getting killed because someone improperly specified resources in another namespace.
Our Solution
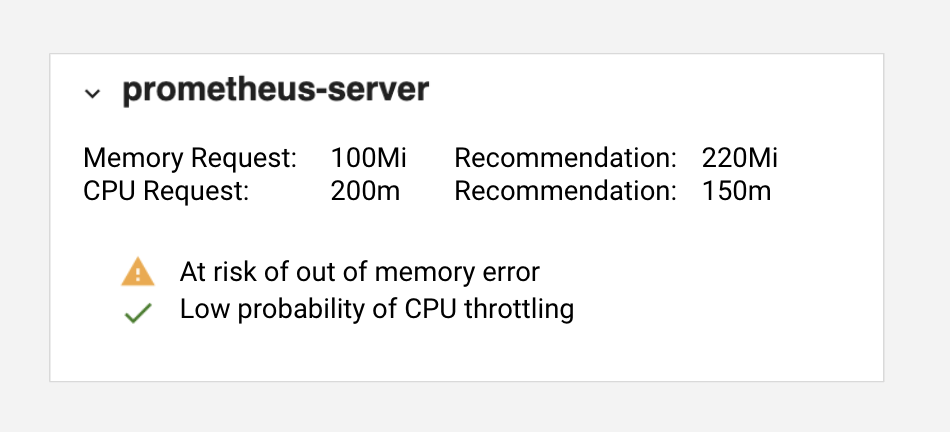
Seeing the difficulty of setting these parameters correctly and managing them over time motivated us to create a solution in the Kubecost product to directly generate recommendations for your applications. Our recommendations are based on a configurable Availability Tiers (e.g. Production or Dev), which is easily tracked by namespace or other concepts directly in the Kubecost product.

In addition to providing request recommendations, this solution also proactively detects out of memory utilization and CPU throttle risks. The full Kubecost product is available via a single Helm command (install options) and these recommendations can easily be viewed for each container in the Namespace view. Our commercial product is free for small clusters, comes with a free trial for larger clusters, and is based on the Kubecost open source project.
Here are sample Prometheus queries if you want to calculate these metrics yourself!
Memory Request (Production Tier)
We recommend container_memory_working_set_bytes because this metric excludes cached data and is what Kubernetes resources use for OOM/scheduling decisions. More info in this article.
1.5 * avg(quantile_over_time(.99,container_memory_working_set_bytes{container_name!="POD",container_name!=""}[7d])) by (container_name,pod_name,namespace)
CPU Request (Production Tier)
First, create a recording rule with this expression. Note we recommend using irate to capture short-term spikes in resource consumption.
avg( irate(container_cpu_usage_seconds_total{container_name!="POD", container_name!=""}[5m]) ) by (container_name,pod_name,namespace)
Then run this query:
1.5 * quantile_over_time(.99,container_cpu_usage_irate[7d])
Automated Container Request Sizing
The goal of Automated Container Request Sizing is to remove the need to worry about specifying values for a container’s CPU usage and memory requests. It can be a great solution in certain situations, often with stateless workloads.
Practical Limitations to Consider
- Pod eviction occurs and needs to be to restarted when the Automated Container Request Sizing requires a change the Pod’s resource requests.
- Automated Container Request Sizing can cause poor performance and risk outages if not configured correctly and adds observability complexity.
- To appropriately handle scale up events, it’s recommended that Cluster Autoscaler also be enabled to handle the increased resource requirements sizes of your workloads.
- Automated Container Request Sizing requires careful tuning to implement a tier-based solution with different parameters for highly available apps, dev, prod, staging etc.
We advise teams to be cautious when using Automated Container Request Sizing for critical production workloads. It introduces complexity to your infrastructure and you should adequately ensure that your deployments and Automated Container Request Sizing itself are configured correctly. Risks aside, it can be a great solution when applied correctly.
More Info on Automated Container Request Sizing
- https://github.com/kubernetes/autoscaler/tree/master/vertical-pod-autoscaler
- https://github.com/kubernetes/design-proposals-archive/blob/main/autoscaling/vertical-pod-autoscaler.md
Conclusion
Setting requests and limits effectively can make or break application performance and reliability in Kubernetes. This set of guidelines and this new Kubecost tool can help you manage the inherent risks and tradeoffs when solution like Automated Container Request Sizing are not the right fit. Our recommendations combined cost data and health insights are available in Kubecost today to help you make informed decisions.
About Kubecost
Kubecost provides cost and capacity management tools purpose built for Kubernetes. We help teams do Kubernetes chargeback, load balancing, resource management, and more. Reach out via email (team@kubecost), Slack or visit our website if you want to talk shop or learn more!
A big thanks to all that have given us feedback and made contributions!