Kubecost 2.3 Release Highlights
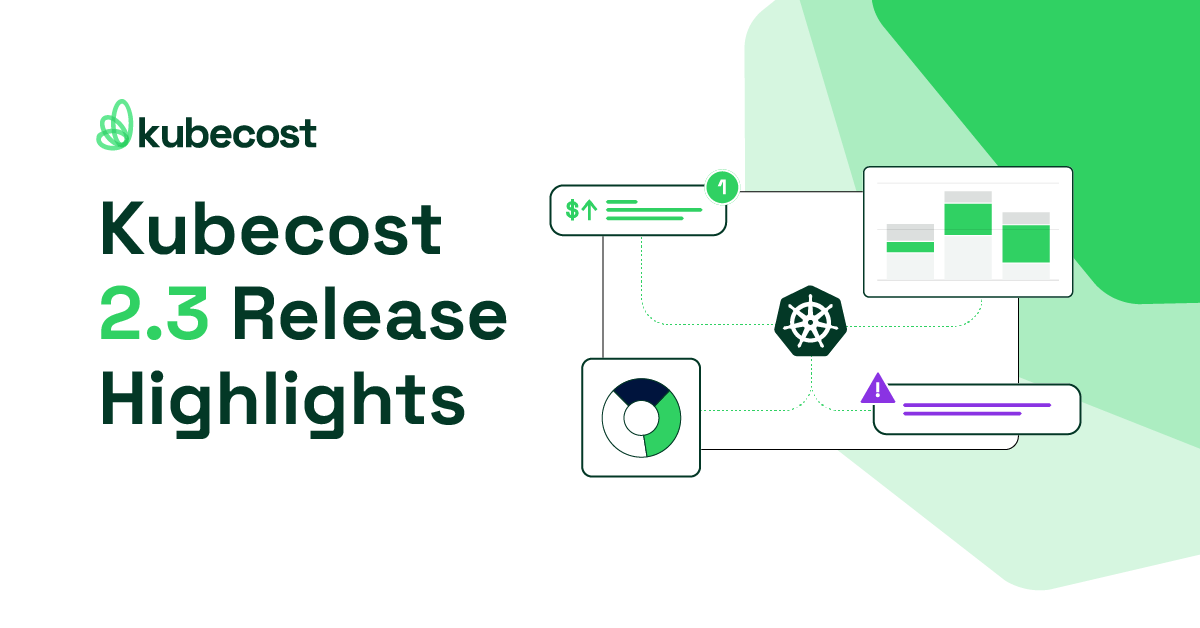
Kubecost 2.3 Release Highlights
We’re excited to announce our latest release of Kubecost, which delivers new efficiency and savings tools plus a suite of improvements throughout. You may have noticed we spent a little more time on this release – this represents the start of an increased investment by Kubecost in the stability and quality of our product. This is the most thoroughly tested release in the history of our company, and while no software is ever bug-free, we are confident this release resolves FAR more issues than it creates.
Additionally, a common thread across the Kubernetes users we talk to is “We’re spending more than we planned”. Usually, it’s FAR more than expected, and it grows every month. Developers, platform teams, and FinOps practitioners face challenges in finding the sources of their continually growing cloud costs so they take action, and need tools to keep those costs down over time. With our 2.3 release, Kubecost users gain another powerful tool to enhance Kubernetes cost optimization and an easy way to measure their cost efficiency over time.
Efficiency Dashboard: Understand at a glance where Kubernetes waste is happening
Available to all free and paid users, the Kubernetes Efficiency dashboard is a powerful tool that simplifies the process of pinpointing your sources of waste, so you can confidently take action and reduce wasted spend across all of your clusters. The Efficiency dashboard provides three different lenses to help you examine the cost vs. utilization efficiency of your Kubernetes environment from week to week, month to month, and quarter by quarter so you can stay on top of cost efficiency as your applications and infrastructure change:
Efficiency Dashboard Views
- Idle by Type: A high-level view of your wasted spend for each cluster broken down by Workload Idle and Infra Idle.
- Resource Idle by Workload: A resource-specific (CPU, RAM, etc.) breakdown of Workload Idle and Workload Efficiency for all your Kubernetes workloads.
- Resource Idle by Cluster: A resource-specific (CPU, RAM, etc.) breakdown of Infra Idle for all your clusters and nodes.

FinOps teams - say hello to your new favorite KPI report. Creeping cloud costs don’t stand a chance.
Developers love the Efficiency dashboard because it saves time and unravels complex and often hidden sources of waste, such as Workload Idle or Infra Idle, that seemingly grow between cloud billing cycles without obvious drivers. Developers can rapidly:
- Locate a cluster with high wastage.
- Drill into the report and track the waste by resource (CPU, RAM, etc.).
- See how much cost can be saved by right-sizing your container request and reducing unused, allocated resources.
The Efficiency dashboard is a great addition to Kubecost’s powerful cloud cost monitoring toolset and will likely become the go-to source for understanding your complete cloud efficiency story. To learn more about this powerful new feature, visit our technical docs
Accelerated Data Ingestion: It’s never been faster or easier to get started with Kubecost
Enjoy a whopping 10X improvement to data ingestion speeds, making it faster and easier to see your cost and operational metrics in Kubecost, especially as a new user.
This improvement comes at the expense of increased memory requirements. Our recommendation is to temporarily remove memory limits (if you use them) for the first few days of running the application. Once a new baseline is recognized, feel free to re-implement your memory limits. If you have any questions or concerns about this, please contact your dedicated Kubecost success manager or reach out to us at team@kubecost.com.
PostgreSQL Integration: Wiring up Kubecost to Power BI is fast and easy
Customers often tell us they’d love to use our data in their existing data storage and analytics platforms like Postgres DB or AWS Redshift so they can easily leverage Kubecost data in their BI Visualization and FinOps tools such as Flexera, Power BI, Tableau, or Looker. The problem? Building and getting that data pipeline working can take a lot of effort, and a degree of complexity is involved.
For Enterprise users, Kubecost’s new Postgres integration makes it a simple experience to export Kubecost data to your existing (or new) data and analytics platform. You’ll save lots of time and testing cycles by configuring our Helm Chart to export the Kubecost data you need.
Custom SMTP Server: Air-gapped networks need notifications, too
Want to send out notifications about Kubecost data using your own private SMTP relay for compliance, privacy, or preference reasons? For Enterprise users Kubecost 2.3 adds the ability to configure a custom SMTP server so you can fire these notifications inside your secure network. To learn more about this new feature, visit our technical docs.
Enhanced Anomaly Detection: Cloud cost spikes, we see you
With Kubecost 2.3.0 you get more control over anomaly detection and an improved Anomalies Dashboard. Anomaly detection is also expanding to detect more things, like anomalies at the account, category, or provider level.
With the new improvements, Kubecost can also detect anomalies in allocations and custom labels. Lastly, Anomaly Detection now has a lookback window, so you can drill in and see anomalies visualized, and fine-tune anomaly detection for the exceptions your team and business care about. To learn more about Anomaly Detection visit our technical docs.
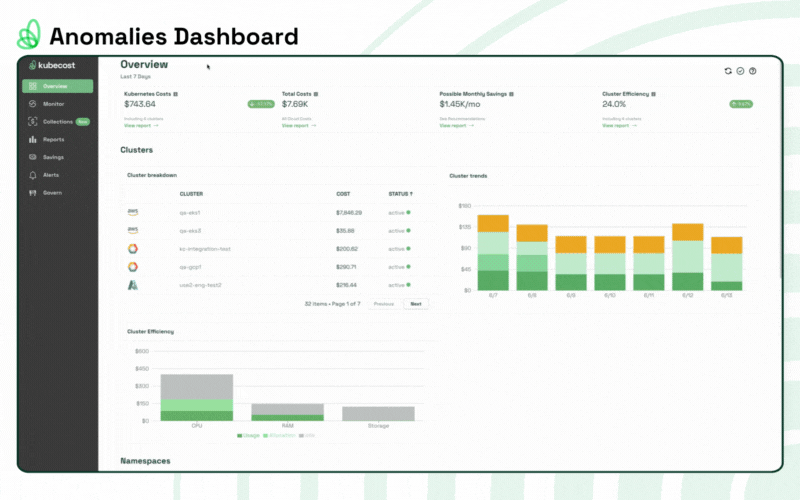
Quickly identify anomalies that could be hidden sources of waste with just a few simple clicks.
Enhancements and Fixes
We expect the 2.3 release to be one of the most stable releases of Kubecost to date! In addition to a record number of bugs resolved, we’ve bundled numerous feature enhancements and bug fixes along with new capabilities. Here’s a recap of the smaller, but always important improvements you’ll find in Kubecost 2.3.
Other 2.3 Enhancements
- Improved troubleshooting diagnostics have been added to enable better support experiences
- Improved the default configurations for SAML/OIDC users
- Enabled cross-provider (GCP to AWS CUR) access
- Record number of bug fixes
- See the full Kubecost 2.3 release notes
How to Upgrade or Get Started
To upgrade your existing Kubecost install, simply run this helm command:
helm repo add kubecost https://kubecost.github.io/cost-analyzer/ && \
helm repo update && \
helm upgrade kubecost kubecost/cost-analyzer -n kubecost
If you aren’t currently using Kubecost, installation is simple. Get started in minutes and embark on a journey towards cost optimization and financial transparency. Your cloud infrastructure (and your wallet) will thank you!